STEP-BY-STEP TECHNOLOGY GUIDE: Boxplots
We will make boxplots for the exports data from Section 3.4, Example 28 on page 163.
TI-83/84
- Step 1 Enter the data in list L1.
- Step 2 Press 2nd Y =, and choose 1: Plot 1.
- Step 3 Highlight On and press ENTER. Highlight the boxplot icon, as shown in Figure 44. Press ENTER.
- Step 4 Press ZOOM, and choose 9: ZoomStat.
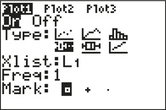 FIGURE 44
MINITAB
- Step 1 Enter the data in column C1, and name your data Exports.
- Step 2 Click Graph > Boxplot…. Select Simple, and click OK.
- Step 3 Double-click on C1 Exports, and click OK, as shown in Figure 45.
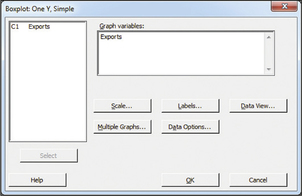 FIGURE 45
SPSS
- Step 1 Input the scores into the first column. Name the column Exports.
- Step 2 Click Graphs > Chart Builder…. Click OK, then Scan Data.
- Step 3 In the Gallery tab, find the Choose from menu and select Boxplot.
- Step 4 Click and drag the Simple boxplot to where it says “Drag a Gallery chart here…” Close the Element Properties box.
- Step 5 Click and drag Exports to where it says “Y-Axis?” in the chart preview.
- Step 6 Click OK.
Page 180
JMP
- Step 1 Click File > New > Data Table. Enter the data into Column 1, and rename the column Exports.
- Step 2 Click Graph > Graph Builder.
- Step 3 Drag Exports from the Variables box to the Y axis. Select Box Plot from the graph options above the plot. Click Done.
CRUNCHIT!
- Step 1 Click File, highlight Load from Larose, Discostat3e > Chapter 3, and click on Example 05_26.
- Step 2 Click Graphics, and select Box Plot. For Data select Exports. Click Calculate.
[Leave] [Close]