Printed Page 217(cont.)
STEP-BY-STEP TECHNOLOGY GUIDE: Regression
Using Table 3, we illustrate the temperature data (page 193).
TI-83/84
- Step 1 Turn diagnostics on as follows: Press 2nd 0. Scroll down and select DiagnosticOn (Figure 29). Press ENTER twice to turn diagnostics on.
- Step 2 Enter the x (low temp) data in L1, and the y (high temp) data in L2.
- Step 3 Press STAT and highlight CALC.
- Step 4 Select LinReg(ax+b).
- Step 5 On the home screen, LinReg(ax+b) appears. Press ENTER.
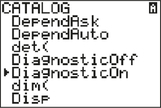 FIGURE 29
EXCEL
- Step 1 Enter the x variable in column A and the y variable in column B, with the topmost cells indicating the variable names, Low and High.
- Step 2 Click on Data > Data Analysis > Regression and click OK.
- Step 3 For Input Y Range, select cells B1–B6. For Input X Range, select cells A1–A6. Check the Labels option, and click OK.
MINITAB
- Step 1 Enter the x (low temp) in C1 and the y (high temp) in C2.
- Step 2 Click on Stat > Regression > Regression > Fit Regression Model….
- Step 3 Select the y variable for the Responses and the x variable for the Continuous predictors. Click OK.
SPSS
- Step 1 Enter the data into the first two columns. Name the columns Low and High.
- Step 2 Click Analyze > Regression > Linear….
- Step 3 Move High to the Dependent box, and Low to the Independent(s) box using the arrows. Click OK.
- Step 4 The Coefficients table has the regression coefficients.
JMP
- Step 1 Click File > New > Data Table. Input the x data into Column 1 and the y data Column 2. Name Column 1 Low Temp, and Column 2 High Temp.
- Step 2 Click Analyze > Fit Y by X.
- Step 3 Click Low Temp under Select Columns, then click X, Factor. Click High Temp under Select Columns, then click Y, Response. Click OK. A scatterplot appears.
- Step 4 Click the red triangle next to “Bivariate Fit of High Temp by Low Temp,” and select Fit Line. Regression output is in the Parameter Estimates table.
CRUNCHIT!
- Step 1 Click File, highlight Load from Larose, Discostat3e > Chapter 4, and click on Example 02_03.
- Step 2 Click Statistics, highlight Regression, and select Simple linear.
- Step 3 For Dependent Variable, select High Temp. For Independent Variable, select Low Temp.
- Step 4 For Display, make sure Numeric Results is selected. Then click Calculate.
[Leave] [Close]