STEP-BY-STEP TECHNOLOGY GUIDE: Z Confidence Intervals for p
We illustrate how to construct the Z confidence interval for p from Example 19 (page 465).
TI-83/84
- Step 1 Press STAT and highlight TESTS.
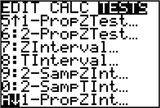
- Step 2 Scroll down to 1-PropZInt (see Figure 32), and press ENTER.
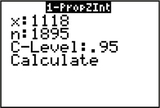
- Step 3 For x, enter the number of success, 1118 .
- Step 4 For n, enter the sample size 1895.
- Step 5 For C-Level (confidence level), enter the appropriate confidence level (e.g., 0.95), and press ENTER (Figure 33).
- Step 6 Highlight Calculate and press ENTER. The results are shown in Figure 28 in Example 20.
 FIGURE 32
 FIGURE 33
Page 470
MINITAB
- Step 1 Click Stat > Basic Statistics > 1 Proportion…
- Step 2 Click Summarized Data.
- Step 3 For Number of events enter 1118, and for Number of trials enter 1895 .
- Step 4 Click on Options…, enter 95 as the Confidence Level, for Method select Normal approximation, and click OK. Then click OK again. The results are shown in Figure 29 in Example 19.
CRUNCHIT!
- Step 1 Click Statistics, highlight Proportion, and select 1-sample.
- Step 2 Choose the Summarized tab. For n, enter the number of trials 1895; for Successes enter 1118 .
- Step 3 Select the Confidence Interval tab, and enter 95 for the Confidence Interval Level (%). Then click Calculate. The results are shown in Figure 30 in Example 19.
[Leave] [Close]