Chapter 9 Review Exercises
section 9.1
For Exercises 1–3, provide the null and alternative hypotheses.
Question 9.386
1. Test whether μ<12.
9.99.1
H0:μ=12 vs. Ha:μ<12
Question 9.387
2. Test whether μ>10.
Question 9.388
3. Test whether μ is below zero.
9.99.3
H0:μ=0 vs. Ha:μ<0
For Exercises 4–6, do the following.
- Provide the null and alternative hypotheses.
- Describe the two ways a correct decision could be made.
- Describe what a Type I error would mean in the context of the problem.
- Describe what a Type II error would mean in the context of the problem.
Question 9.389
4. Household Size. The U.S. Census Bureau reported (2010) that the mean household size is 2.58 persons. We conduct a hypothesis test to determine whether the population mean household size has changed.
Question 9.390
5. Speeding-Related Traffic Fatalities. The National Highway Traffic Safety Administration reports that the mean number of speeding-related traffic fatalities over the Thanksgiving holiday period from 1994 to 2003 was 202.7. We conduct a hypothesis test to examine whether the population mean number of such fatalities has decreased.
9.99.5
(a) H0:μ=202.7 vs. Ha:μ<202.7 (b) We conclude that (1) the population mean number of speeding-related fatalities is less than 202.7 when it actually is and (2) the mean number of speeding-related fatalities is not less than 202.7 when it actually is. (c) The population mean number of speeding-related fatalities is less than 202.7 when it actually is not less than 202.7. (d) The population mean number of speeding-related fatalities is not less than 202.7 when it actually is less than 202.7.
Question 9.391
6. Salaries of Accounting Associate Professors. Salary.com reports that the mean salary for accounting associate professors in 2014 was $94,000. A hypothesis test was conducted to determine if the population mean salary of accounting associate professors has increased.
section 9.2
For Exercises 7–9, find the value of Zdata.
Question 9.392
7. ˉx=59,σ=10,n=100,μ0=60
9.99.7
–1
Question 9.393
8. ˉx=59,σ=5,n=100,μ0=60
Question 9.394
9. ˉx=59,σ=1,n=100,μ0=60
9.99.9
–10
For each of the following hypothesis tests in Exercises 10–12, do the following:
- Find the value of Zdata.
- Find the critical-value rejection rule.
- Draw a standard normal curve and indicate the critical region.
- State the conclusion and interpretation.
Question 9.395
10. H0:μ=μ0 vs. Ha:μ≠μ0,α=0.01, Zdata=-2.5
Question 9.396
11. H0:μ=μ0 vs. Ha:μ>μ0,α=0.10, Zdata=1.5
9.99.11
(a) 1.28 (b) Reject H0 if Zdata≥1.28.
(c)
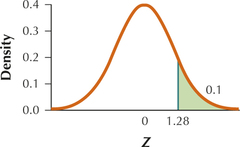
(d) Since Zdata≥1.28, we reject H0. There is evidence that the population mean is greater than μ0.
Question 9.397
12. H0:μ=μ0 vs. Ha:μ>μ0,α=0.05, Zdata=-2.5
Question 9.398
13. Credit Scores in Georgia. According to CreditReport. com, the mean credit score in Georgia in 2014 was 668. A random sample of 144 Georgia residents this year shows a mean credit score of 650. Assume a=50. Perform a hypothesis test, using level of significance α=0.05, to determine if the population mean credit score in Georgia has decreased.
- State the hypotheses.
- Find the value of Zcrit and the rejection rule. Also, draw a standard normal curve, indicating the critical region.
- Calculate Zdata. Draw a standard normal curve showing Zcrit, the critical region, and Zdata.
- State the conclusion and the interpretation.
9.99.13
(a) H0:μ=668 vs. Ha:μ<668 –(b) −1.645; reject H0 if Zdata≤−1.645 (c) Zdata=−4.32
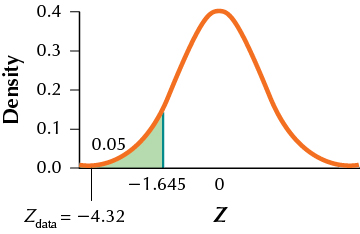
(d) Since Zdata≤−1.645, we reject H0. There is evidence that the population mean credit score in Georgia is less than 668.
section 9.3
For Exercises 14 and 15, perform the following steps:
- State the hypotheses and the rejection rule for the p-value method.
- Calculate Zdata.
- Find the p-value. Draw the standard normal curve, with Zdata and the p-value indicated on it.
- State the conclusion and the interpretation.
Question 9.399
14. We are interested in testing at level of significance α=0.05 whether the population mean differs from 500. A random sample of size 100 is taken, with a mean of 520. Assume σ=50.
Question 9.400
15. We want to test, at level of significance α=0.01, whether the population mean is less than −10. A random sample of size 25 is taken from a normal population. The sample mean is −12. Assume σ=2.
9.99.15
(a) H0:μ=−10 vs. H0:μ<−10. Reject H0 if the p-value≤0.01. (b) −5 (c) p-value=2.87105×10⁻⁷
(d) Since the p-value≤ 0.01, reject H0. There is evidence that the population mean is less than −10.
Question 9.401
16. Sleeping During the Full Moon. A study found that subjects slept on average 20 minutes less on nights of the full moon than otherwise.21 Other researchers disagree and are interested in testing whether the mean difference in sleep is less than 20 minutes. A random sample of 100 subjects showed that they slept, on average, 10 minutes less on nights of the full moon than otherwise. Assume the population standard deviation is 15 minutes. Perform the appropriate hypothesis test using level of significance α=0.01.
section 9.4
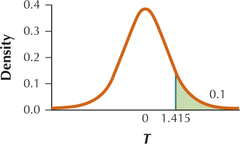
For Exercises 17–19, find the critical value tcrit and sketch the critical region. Assume normality.
Question 9.402
17. H0:μ=100, Ha:μ>100,n=8,α=0.10
9.99.17
tcrit=1.415
Question 9.403
18. H0:μ=100, Ha:μ>100,n=8,α=0.05
Question 9.404
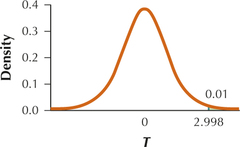
19. H0:μ=100, Ha:μ>100,n=8,α=0.01
9.99.19
tcrit=2.998
Question 9.405
20. Describe what happens to the t critical value tcrit for right-tailed tests as α decreases.
Question 9.406
21. A random sample of size 16 from a normal population yields a sample mean of 10 and a sample standard deviation of 3. Test whether the population mean differs from 9, using level of significance α=0.10.
9.99.21
H0:μ=9 vs. H0:μ≠9. tcrit=1.753. Reject H0 if tdata≤−1.753 or tdata≥1.753. Since tdata is not ≤−1.753 and tdata is not ≥1.753 we do not reject H0. There is insufficient evidence that the population mean is different from 9.
Question 9.407
22. A random sample of size 144 from an unknown population yields a sample mean of 45 and a sample standard deviation of 10. Test whether the population mean differs from 45, using level of significance α=0.10.
section 9.5
For Exercises 23–25, do the following:
- Check the normality conditions.
- State the hypotheses.
- Find Zcrit and the rejection rule.
- Calculate Zdata.
- State the conclusion and the interpretation.
Question 9.408
23. Test whether the population proportion exceeds 0.8. A random sample of size 1000 yields 830 successes. Let α=0.10.
9.99.23
(a) We have np0=100(0.8)=800≥5 and n(1−p0)=1000(1−0.8)=200≥5. (b) H0:p=0.8 vs. H0:p>0.8 (c) Zcrit=1.28. Reject H0 if Zdata≥1.28. (d) Zdata=2.37 (e) Since Zdata≥1.28, we reject H0. There is evidence that the population proportion is greater than 0.8.
Question 9.409
24. Test whether the population proportion is below 0.2. A random sample of size 900 yields 160 successes. Let α=0.05.
Question 9.410
25. Test whether the population proportion is not equal to 0.4. A random sample of size 100 yields 55 successes. Let α=0.01. For Exercises 26 and 27, do the following:
- Check the normality conditions.
- State the hypotheses and the rejection rule for the p-value method, using level of significance α=0.05.
- Calculate Zdata.
- Calculate the p-value.
- State the conclusion and the interpretation.
9.99.25
(a) We have np0=100(0.4)=40≥5 and n(1−p0)=100(1−0.4)=60≥5. (b) H0:p=0.4 vs. Ha:p≠0.4 (c) Zcrit=2.58. Reject H0 if Zdata≤−2.58 or Zdata≥2.58. (d) Zdata=3.06 (e) Since Zdata≥2.58, we reject H0. There is evidence that the population proportion is not equal to 0.4.
Question 9.411
26. Test whether the population proportion differs from 0.7. A random sample of size 144 yields 110 successes.
Question 9.412
27. Test whether the population proportion is less than 0.25. A random sample of size 100 yields 25 successes.
9.99.27
(a) We have np0=100(0.25)=25≥5 and n(1−p0)=100(1−0.25)=75≥5. (b) H0:p=0.25 vs. Hα:p<0.25. Reject H0 if the p-value≤0.05. (c) 0 (d) 0.5 (e) Since the p-value is not ≤0.05, we do not reject H0. There is insufficient evidence that the population proportion is less than 0.25.
Question 9.413
28. DSL Internet Service. The U.S. Department of Commerce reports that 41.6% of Internet users preferred DSL as their method of service delivery.22 A random sample of 1000 Internet users shows 350 who preferred DSL. If appropriate, test whether the population proportion who prefer DSL has decreased, using level of significance α=0.05.
section 9.6
For Exercises 29 and 30, assume normality of the data, and do the following:
- State the hypotheses.
- Find the χ2 critical value or values, and state the rejection rule.
- Find χ2data. Also, draw a χ2 distribution and indicate χ2data and the χ2 critical value or values.
- State the conclusion and the interpretation.
Question 9.414
29. We are testing whether σ>6 and have a random sample of size 20 with a standard deviation of s=9. Let α=0.05.
9.99.29
(a) H0:σ=6 vs. Ha:σ>6 (b) χ2a=χ20.05=30.144. Reject H0 if χ2data≥30.144. (c) χ2data=42.75
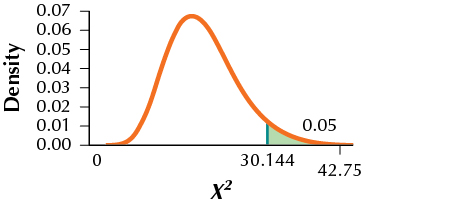
(d) Since χ2data≥30.144, we reject H0. There is evidence that the population standard deviation is greater than 6.
Question 9.415
30. We are testing whether σ≠10 and have a random sample of size 26 with a sample variance of 90. Let α=0.05.
For Exercises 31 and 32, assume normality of the data, and do the following:
- State the hypotheses and the p-value rejection rule for α=0.05.
- Find χ2data.
- Find the p-value. Also, draw a χ2 distribution and indicate χ2data and the p-value.
- State the conclusion and the interpretation.
Question 9.416
31. We are testing whether σ<35 and have a random sample of size eight with a sample variance of 1200.
9.99.31
(a) H0:σ=35 vs. Ha:σ<35. Reject H0 if the p-value≤0.05. (b) 6.857 (c) p-value=0.5560805474
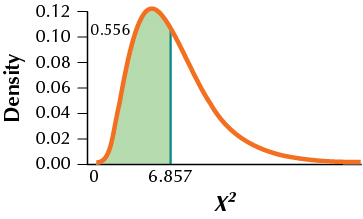
(d) Since the p-value is not ≤0.05, we do not reject H0. There is insufficient evidence that the population standard deviation is less than 35.
Question 9.417
32. We are testing whether σ≠50 and have a random sample of size 26 with a standard deviation of s=45.
section 9.7
For Exercises 33–38, assume that the conditions for performing the Z test are met. Do the following:
- Calculate the value or values of ˉxcrit.
- Draw a normal curve, centered at μa, with the value or values of ˉxcrit indicated.
- Calculate β, the probability of a Type II error for that value of μa. Shade the corresponding area under the normal curve.
- Calculate the power of the hypothesis test.
Question 9.418
33. H0:μ=100 vs. Ha:μ≠100,α=0.01,σ=15,n=64,μa=103
9.99.33
(a) ˉxcritical, lower=95.1625, ˉxcritical, upper=104.8375
(b)
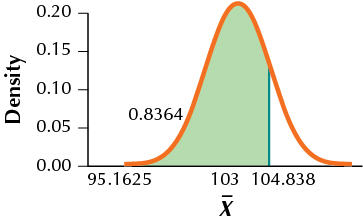
(c) TI-83/84: 0.8364 (d) 0.1636
Question 9.419
34. H0:μ=100 vs. Ha:μ≠100,α=0.01,σ=15,n=64,μa=106
Question 9.420
35. H0:μ=100 vs. Ha:μ≠100,α=0.01,σ=15,n=64,μa=109
9.99.35
(a) ˉxcritical, lower=95.1625, ˉxcritical, upper=104.8375
(b)
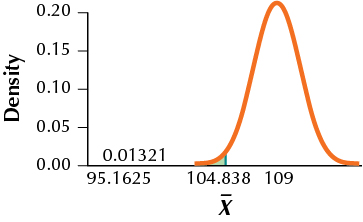
(c) TI-83/84: 0.0132 (d) 0.9868
Question 9.421
36. H0:μ=100 vs. Ha:μ≠100,α=0.01,σ=15,n=64,μa=112
Question 9.422
37. H0:μ=100 vs. Ha:μ≠100,α=0.01,σ=15,n=64,μa=115
9.99.37
(a) ˉxcritical, lower=95.1625, ˉxcritical, upper=104.8375
(b)
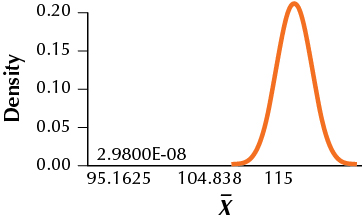
(c) 0 (d) 1
Question 9.423
38. Refer to Exercises 33–37. Construct the power curve for the given values of μa.