Descriptive Research
KEY THEME
Descriptive research is used to systematically observe and describe behavior.
KEY QUESTIONS
What are naturalistic observation and case study research, and why and how are they conducted?
What is a survey, and why is random selection important in survey research?
What are the advantages and disadvantages of each descriptive method?
Descriptive research designs include strategies for observing and describing behavior. Using descriptive research designs, researchers can answer important questions, such as when certain behaviors take place, how often they occur, and whether they are related to other factors, such as a person’s age, ethnic group, or educational level. As you’ll see in this section, descriptive research can provide a wealth of information about behavior, especially behaviors that would be difficult or impossible to study experimentally.

Left: In 1980, a single humpback whale was first seen whacking the water with his tail, a foraging technique called “lobtail feeding.” Researchers used naturalistic observation to track the spread of this feeding technique throughout a humpback whale population (Allen & others, 2013; de Waal, 2013).
Right: After media reports of aggressive behavior by adult spectators at Canadian youth hockey games, psychologist Anne Bowker and five other observers (2009) systematically recorded the comments of adult spectators at youth hockey games. They found that two-
Naturalistic Observation
THE SCIENCE OF PEOPLE-
When psychologists systematically observe and record behaviors as they occur in their natural settings, they are using the descriptive method called naturalistic observation. Usually, researchers engaged in naturalistic observation try to avoid being detected by their subjects, whether people or nonhuman animals. The basic goal of naturalistic observation is to detect the behavior patterns that exist naturally—


As you might expect, psychologists very carefully define the behaviors that they will observe and measure before they begin their research. Often, to increase the accuracy of the observations, two or more observers are used. In some studies, observations are recorded so that the researchers can carefully analyze the details of the behaviors being studied.
One advantage of naturalistic observation is that it allows researchers to study human behaviors that cannot ethically be manipulated in an experiment. For example, suppose that a psychologist wants to study bullying behavior in children. It would not be ethical to deliberately create a situation in which one child is aggressively bullied by another child. However, it would be ethical to study bullying by observing aggressive behavior in children on a crowded school playground (Drabick & Baugh, 2010).
As a research tool, naturalistic observation can be used wherever patterns of behavior can be openly observed—
Case Studies
DETAILS, DETAILS, DETAILS
A case study is an intensive, in-
Case studies are also used in psychological research investigating rare, unusual, or extreme conditions. These kinds of case studies often provide psychologists with information that can be used to help understand normal behavior. For example, the Chapter 3 Prologue features the story of Mike May, who partially regained his sight after being blind since early childhood. You’ll read how the information gained from extensive testing of Mike’s brain and visual abilities has provided insights into brain and visual development in normally sighted individuals.
While case studies can provide invaluable information, they also have limitations. The most important limitation is that the findings on people with rare or unusual conditions might not apply to people in the broader population.
Surveys
(A) ALWAYS (B) SOMETIMES (C) NEVER (D) HUH?
How much time do you spend studying and preparing for class? Is it more, less, or about the same amount of time as other students at your college? Do students in some majors study more than students in other majors?
How could you find out the answers to such questions? A direct way to find out about the behavior, attitudes, and opinions of people is simply to ask them. In a survey, people respond to a structured set of questions about their experiences, beliefs, behaviors, or attitudes. One key advantage offered by survey research is that information can be gathered from a much larger group of people than is possible with other research methods.
Typically, surveys involve carefully constructed questionnaires. Questionnaires may be paper, Internet-
Surveys are seldom administered to everyone within the particular group or population under investigation. Instead, researchers usually select a sample—a segment of the group or population. Selecting a sample that is representative of the larger group is the key to getting accurate survey results. A representative sample very closely parallels, or matches, the larger group on relevant characteristics, such as age, sex, race, marital status, and educational level.
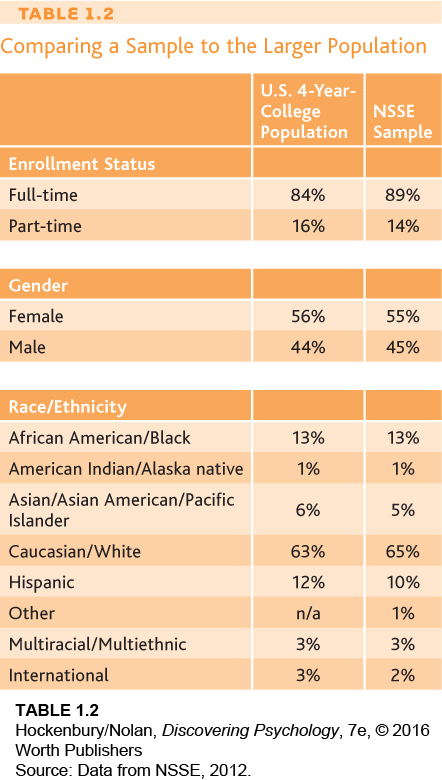
How do researchers select participants so that their sample is representative of the larger group? The most common strategy is to randomly select the sample participants. Random selection means that every member of the larger group has an equal chance of being selected for inclusion in the sample. To illustrate, let’s look at the National Survey of Student Engagement (2012), a survey of almost 300,000 U.S. college students and 22,000 Canadian college students. The NSSE surveys college freshmen and seniors about the nature and quality of their educational experience. Table 1.2 shows how the randomly selected sample surveyed in the NSSE compares to the broader population of U.S. undergraduates enrolled in four-
What did the NSSE find? Among other findings, they discovered that first-
One potential problem with surveys and questionnaires is that people do not always answer honestly, especially when they are asked questions about sexual activity, drug or alcohol use, or illegal activities. The tendency to respond in socially desirable ways can be addressed in a carefully designed survey. One strategy is to rephrase the question and ask for the same information in a different way at different points during the survey. Researchers can then compare the responses to make sure that the participant is responding honestly and consistently. There is some evidence that participants are more likely to respond honestly to Internet or computer-
Correlational Studies
LOOKING AT RELATIONSHIPS AND MAKING PREDICTIONS: CAN EATING CURLY FRIES MAKE YOU SMARTER?
KEY THEME
Correlational studies show how strongly two factors are related.
KEY QUESTIONS
What is a correlation coefficient?
What is the difference between a positive correlation and a negative correlation?
Why can’t correlational studies be used to demonstrate cause-
and- effect relationships?
Along with answering the who, what, where, and when questions, the data gathered by descriptive research techniques can be analyzed to show how various factors are related. A correlational study examines how strongly two variables are related to, or associated with, each other. Correlations can be used to analyze the data gathered by any type of descriptive method, and are also used to analyze the results of experiments.
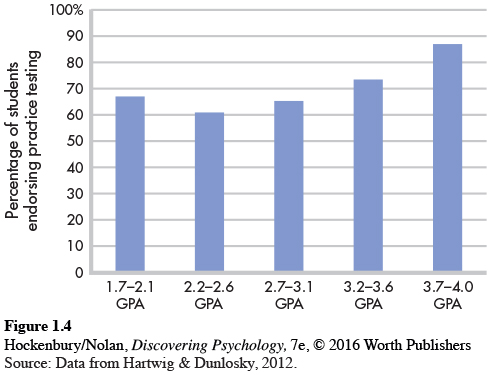
To illustrate, let’s look at a correlational study conducted by psychologists Marissa K. Hartwig and John Dunlosky (2012). Hartwig and Dunlosky were interested in identifying the study habits most strongly linked to academic success. They surveyed 324 college students at a large state university. They used self-
A correlation coefficient is a numerical indicator of the strength of the relationship between two factors. A correlation coefficient always falls in the range from −1.00 to +1.00. The correlation coefficient has two parts—
More specifically, the closer a correlation coefficient is to 1.00, whether it is positive or negative, the stronger the correlation or association is between the two factors. Hence, a correlation coefficient of+.90 or −.90 represents a very strong association, meaning that the two factors almost always occur together. A correlation coefficient of+.10 or −.10 represents a very weak correlation, meaning that the two factors seldom occur together. (Correlation coefficients are discussed in greater detail in Appendix A on statistics, at the back of this book.)
Notice that correlation coefficients do not function like the algebraic number line. A correlation of −.80 represents a stronger relationship than does a correlation of+.10. The plus or minus sign in a correlation coefficient simply tells you the direction of the relationship between the two variables.
A positive correlation is one in which the two factors vary in the same direction. That is, the two factors increase or decrease together. For example, Hartwig and Dunlosky (2012) found that there was a strong positive correlation between GPA and use of self-

In contrast, a negative correlation is one in which the two variables move in opposite directions: As one factor decreases, the other increases. In a study investigating the relationship between multitasking and GPA, Reynol Junco and Shelia Cotten (2012) found that there was a negative correlation between time spent sending text messages while studying and GPA: As time spent texting while studying increased, GPA decreased.
What can we conclude about the relationship between academic achievement and sending texts while studying? Or GPA and self-
Not necessarily. Consider the negative correlation between GPA and time spent texting while studying. It could be that a third variable was responsible for the associations between texting and GPA. Perhaps students who send texts while studying do so because they lack academic motivation, or are uninterested in the subject matter. In other words, it might be that a lack of academic motivation or interest, rather than sending texts, was actually responsible for the lower grades.
Similarly, consider the positive correlation between self-
Here is the critical point: Even if two factors are very strongly correlated, correlation does not necessarily indicate causality. A correlation tells you only that two factors seem to be related or that they co-
Test your understanding of The Scientific Method and Descriptive Research Methods with