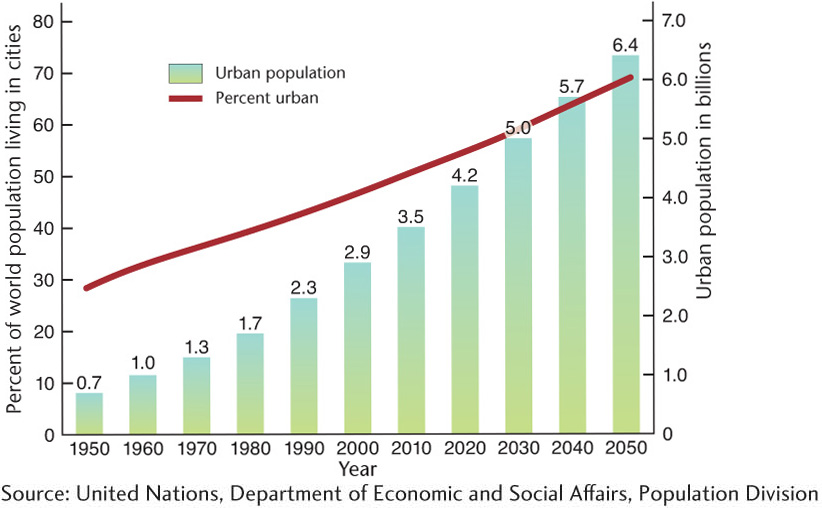
Figure 10.1 People living in cities. This graph depicts the changing percentage, and total number, of people living in urban areas across the century spanning 1950 to 2050. (Source: United Nations, Department of Economic and Social Affairs, Population Division.)