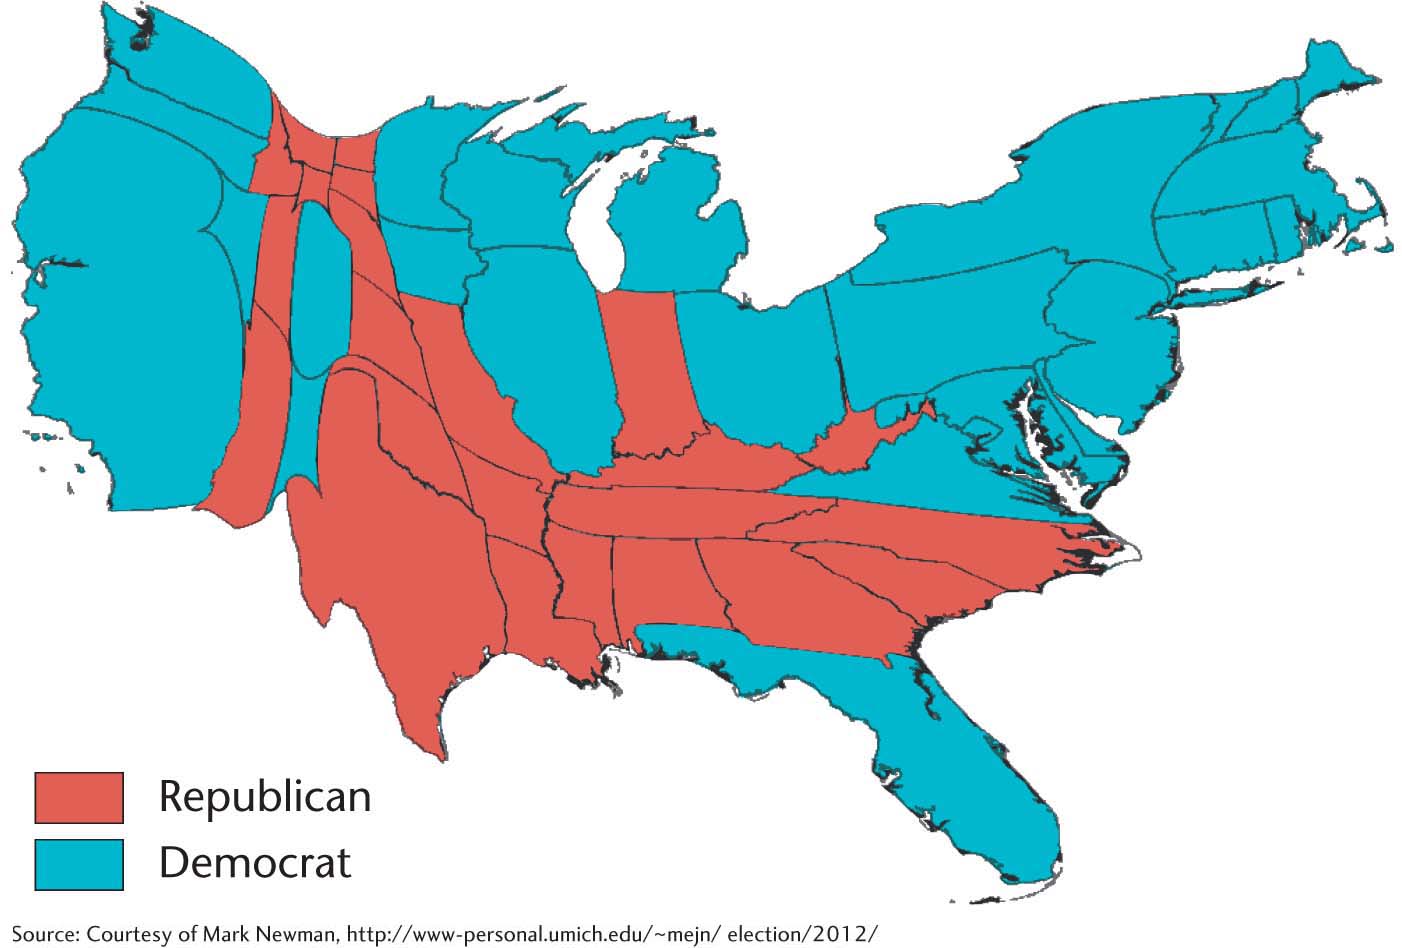
Figure 6.11 Cartogram of the 2012 presidential election results. This map sizes America’s 50 states in proportion to their respective populations. How does this cartogram compare to the map in Figure 6.10 in its representation of the relative popularity of the Republican and Democratic candidates? (Source: Courtesy of Mark Newman, http://www-personal.umich.edu/~mejn/election/2012/.)