Variable Stars
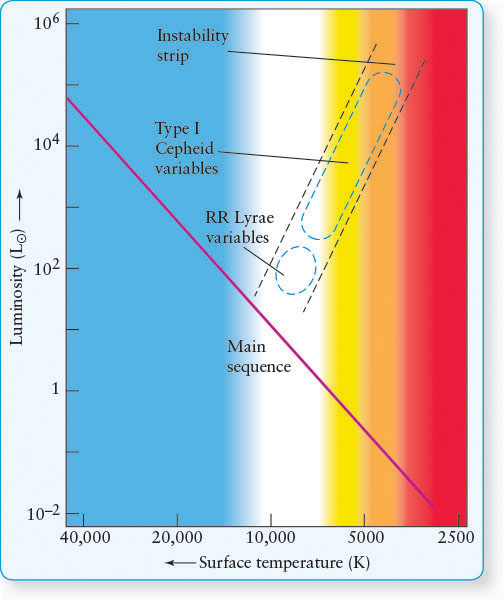
After core helium fusion begins, the evolutionary tracks of mature stars move partway back toward the main sequence (right to left on an H-R diagram; Figure 12-25b). Their pressure-temperature safety valves are not perfect, so as they shrink, they overheat and core fusion causes them to expand to larger sizes than they would be at equilibrium. Becoming too large, their pressure and temperature decrease and they collapse, overcompressing and thereby overheating themselves again. This process is analogous to dropping a tennis ball, which bounces repeatedly after striking the ground. In other words, a star under these conditions becomes unstable and pulsates. The region on the H-R diagram between the main sequence and the right side of the giant branch, where this occurs, is called the instability strip (Figure 12-26). These so-called variable stars can be easily identified by their changes in brightness amid a field of stars of constant luminosity.
391
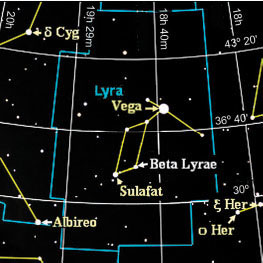
Lower-mass, post–helium-flash stars pass through the lower end of the instability strip as they move horizontally on the H-R diagram along their evolutionary tracks. These stars become RR Lyrae variables, named after the prototype in the constellation of Lyra (the Lyre). RR Lyrae variables all have periods shorter than 1 day. Higher-mass stars that evolve from the same interstellar medium as RR Lyrae pass back and forth through the upper end of the instability strip on the H-R diagram. These stars become Type I Cepheid variables, often simply called Cepheids. (There is another whole group of variable stars called Type II Cepheids that formed earlier in the history of the universe from gases with virtually no metals. We discuss them in more detail shortly.)
12-12 A Cepheid pulsates because it is alternately expanding and contracting
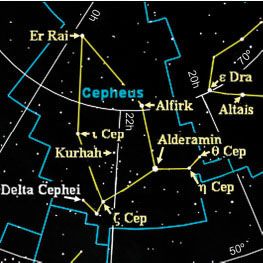
A Cepheid variable is characterized by the way in which its light output varies—most of these stars follow a pattern of rapid brightening followed by gradual dimming. A Cepheid variable brightens and fades because the star’s outer layers cyclically expand and contract. Lines in the spectrum of δ (delta) Cephei shift back and forth with the same 5.4-day period that characterizes its variations in magnitude. According to the Doppler effect measured from this star, these shifts mean that the star’s surface is alternately approaching and receding from us. When a Cepheid variable pulsates, its gases alternately heat up and cool down; the surface temperature cycles between about 6300 K and 5000 K. Thus, the characteristic light curve (luminosity versus time curve, as in Figure 11-13) of a Cepheid variable results from changes in both size and surface temperature.
Margin Question 12-12
Question
How do astronomers observe that Cepheids are changing size?
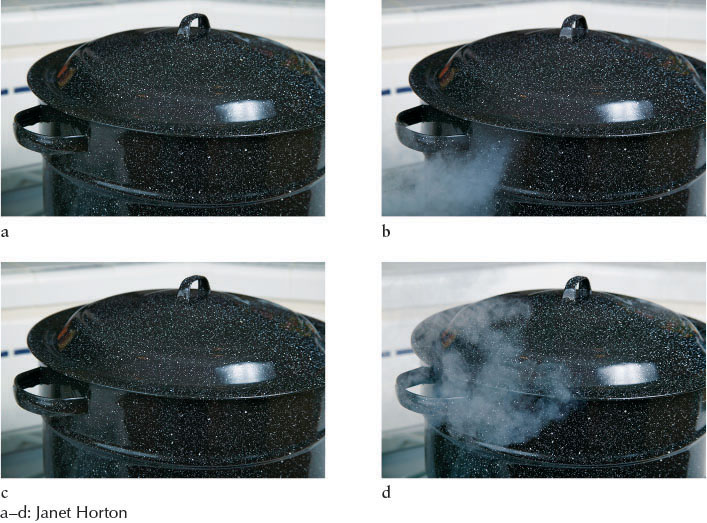
Just as a bouncing ball eventually comes to rest, a pulsating star would soon stop pulsating without some mechanism to maintain its oscillations. Variable stars have a layer of gas rich in partially ionized helium (helium with one electron stripped off). This gas, absorbing a lot of photons leaving the core, heats, expands, and pushes the outer layers outward, just as steam raises the lid of a pot (Figure 12-27). Eventually, the ionized helium layer is spread so thin that photons pass through it. The ionized helium cools and contracts, and the star’s outer layers collapse, compressing the interior gases until the process repeats itself. In our analogy with the pot of boiling water, when enough of the steam inside escapes, the lid falls back and the steam inside builds up again. Variability only occurs when the conditions of temperature and pressure inside the star are appropriate. As a result, giants are variable only when the stars are in the instability strip of an H-R diagram.
392
12-13 Cepheids enable astronomers to estimate vast distances
The details of a Cepheid’s pulsation depend on the abundance of heavy elements in its atmosphere. The average luminosity of metal-rich Cepheids is roughly 4 times greater than the average luminosity of metal-poor Cepheids that have the same period. The difference in luminosity is a result of the higher mass of the metal-rich Cepheids compared to the metal-poor ones. Thus, there are two classes: Type I Cepheids (also called δ Cephei stars), which are the brighter, more massive, metal-rich stars, and Type II Cepheids, which are the dimmer, lower mass, metal-poor stars. The period-luminosity relations for both types of variables are shown in Figure 12-28.
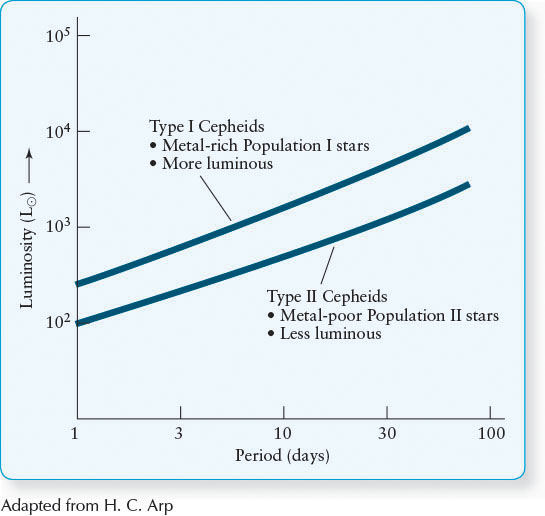
Cepheids are important to astronomers because there is a direct relationship between a Cepheid’s period of pulsation and its average luminosity. This correlation is called, appropriately enough, the period-luminosity relation. We can determine the distance to a Cepheid in four steps. First, we observe its period. Second, we use the period-luminosity relation, shown graphically in Figure 12-28, to determine its luminosity and, hence, its absolute magnitude (recall that the luminosity and absolute magnitudes are directly related to each other). Third, we observe its apparent magnitude. Finally, we use the distance-magnitude relationship in An Astronomer’s Toolbox 11-3: The Distance-Magnitude Relationship to calculate its distance.
Intrinsically dim Type I Cepheid variables pulsate rapidly, with periods of 1 to 2 days, and have average brightness variations of a few hundred times our Sun’s luminosity. The most luminous of these Cepheids have the longest periods of all Cepheids, with variations occurring over 100 days and average brightness variations equaling 10,000 L⊙. As they are so bright, we can see Cepheids far beyond the boundaries of our Milky Way Galaxy. Because the changes in brightness of Cepheids can be seen at distances where other techniques for measuring distance, such as stellar parallax, fail, the period-luminosity relation plays an important role in determining the overall size and structure of the universe. We will explore this application further in Chapter 16.
Insight Into Science: Firm Foundations?
To determine things far from our everyday size and timescales, scientists often must base their results on the predictions of complex theories, even before all of the testing and refinement of the theories are complete. An error anywhere along the chain of ideas leads to incorrect results. For example, using the Cepheid variable stars to measure distances requires combining several intermediate concepts, including believing that the period-luminosity relationship applies well to all Cepheids, believing that there are just two different types of Cepheids, and assuming that the peak luminosity depends only on the Cepheid’s distance from us (not correct if there are gas and dust between us and the star, as there often are). If any of these or myriad other assumptions are wrong, the calculated distances will be incorrect.
12-14 Globular clusters are bound groups of old stars
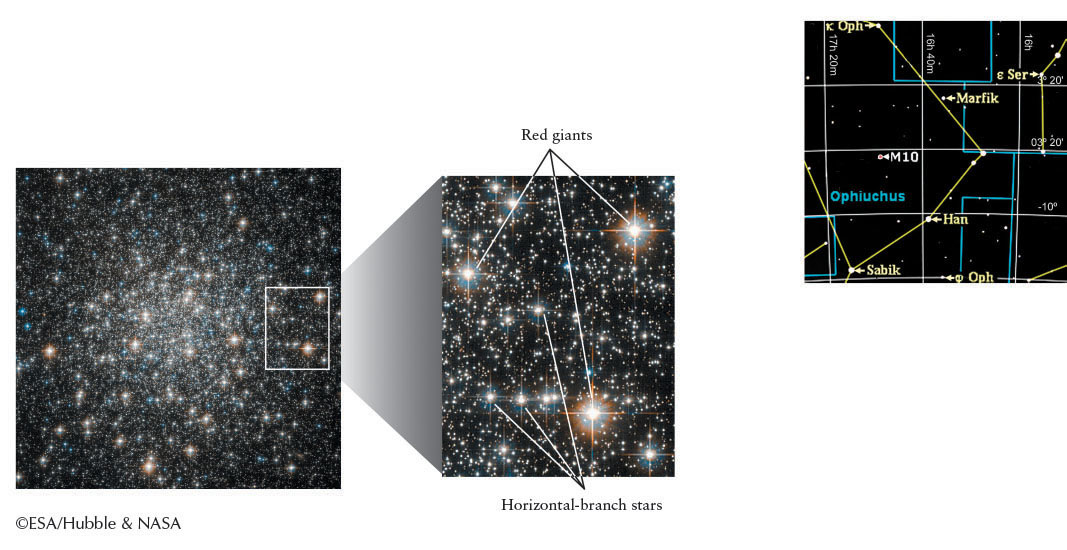
Many giant stars are found in groups, called globular clusters, so named because of their spherical shapes. A typical globular cluster, like the one shown in Figure 12-29, may contain up to a million stars in a volume 200 light-years across. Like open clusters, the stars in globular clusters all formed at about the same time. Unlike open clusters of young stars, however, globular clusters are gravitationally bound groups of old stars from which few stars escape. At least 157 globular clusters in our Galaxy are spherically distributed around the center of the Milky Way. Other galaxies also have them located in similar distributions.
393
Astronomers know that most globular clusters are old because they contain no high-mass main-sequence stars. (The young star cluster Westerlund 1 in our Galaxy and similar clusters elsewhere are apparently exceptions. These are discussed later in this section.) If you measure the luminosity and surface temperature of many stars in an older globular cluster and plot the data on a color-magnitude diagram (Figure 12-30), you will find that the upper half of the main sequence is missing. All of the high-mass main-sequence stars evolved long ago into giants, leaving behind only lower mass, more slowly evolving main-sequence stars still undergoing core hydrogen fusion.
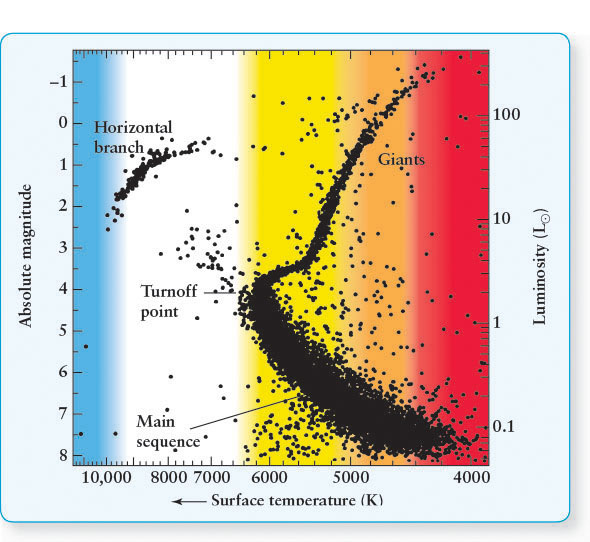
The H-R diagram of a globular cluster typically shows a roughly horizontal grouping of stars to the left of the center portion of the diagram (see Figure 12-30). These hot stars of less than 2 M⊙, called horizontal branch stars (see Figure 12-29), have undergone a helium flash and are now fusing helium in their cores. They have luminosities of about 50 L⊙. Eventually, these stars will move back toward the giant region as core helium fusion and hydrogen shell fusion devour their fuel.
Margin Question 12-13
Question
What are typical periods of Cepheid variable stars?
As noted earlier, an H-R diagram of a cluster can also be used to determine the age of the cluster, assuming that all of the stars in the cluster formed at the same time. In the H-R diagram for a young open cluster (review Figure 12-19b), almost all of the hot massive stars are still on the main sequence. As a cluster ages, like the Pleiades, stars begin to leave the main sequence (see Figure 12-3c). The high-mass, high-luminosity stars are the first to become giants. We can determine the ages of globular clusters in the same way, since it appears that all the stars in a given cluster form at the same time.
Margin Question 12-14
Question
Which are older, stars in open clusters or stars in globular clusters?
394
Over time, the main sequence in a cluster gets shorter and shorter. The top of the surviving portion of the main sequence is called the turnoff point (see Figure 12-30). Stars at the turnoff point are just beginning to exhaust the hydrogen in their cores. The theory of stellar evolution enables us to predict how long stars with different masses last on the main sequence before moving toward the giant stage. Therefore, the age of the stars currently at the turnoff point is the age of the cluster (recall Table 12-2). Consider the plot for the globular cluster M55, shown in Figure 12-30. In M55, 0.9 M⊙ stars are just leaving the main sequence. Therefore, according to Table 12-2, the cluster’s age is approximately 12.5 billion years.
Using data collected from the Hipparcos satellite, Figure 12-31a is a composite diagram of isolated and cluster stars, reflecting the overall structure of the H-R diagram. Using data from stellar evolution theory as presented in Table 12-2, the ages of star clusters can be estimated from the turnoff points, such as those depicted in Figure 12-31b. The evolution of a cluster is summarized in Figure 12-31c–j.
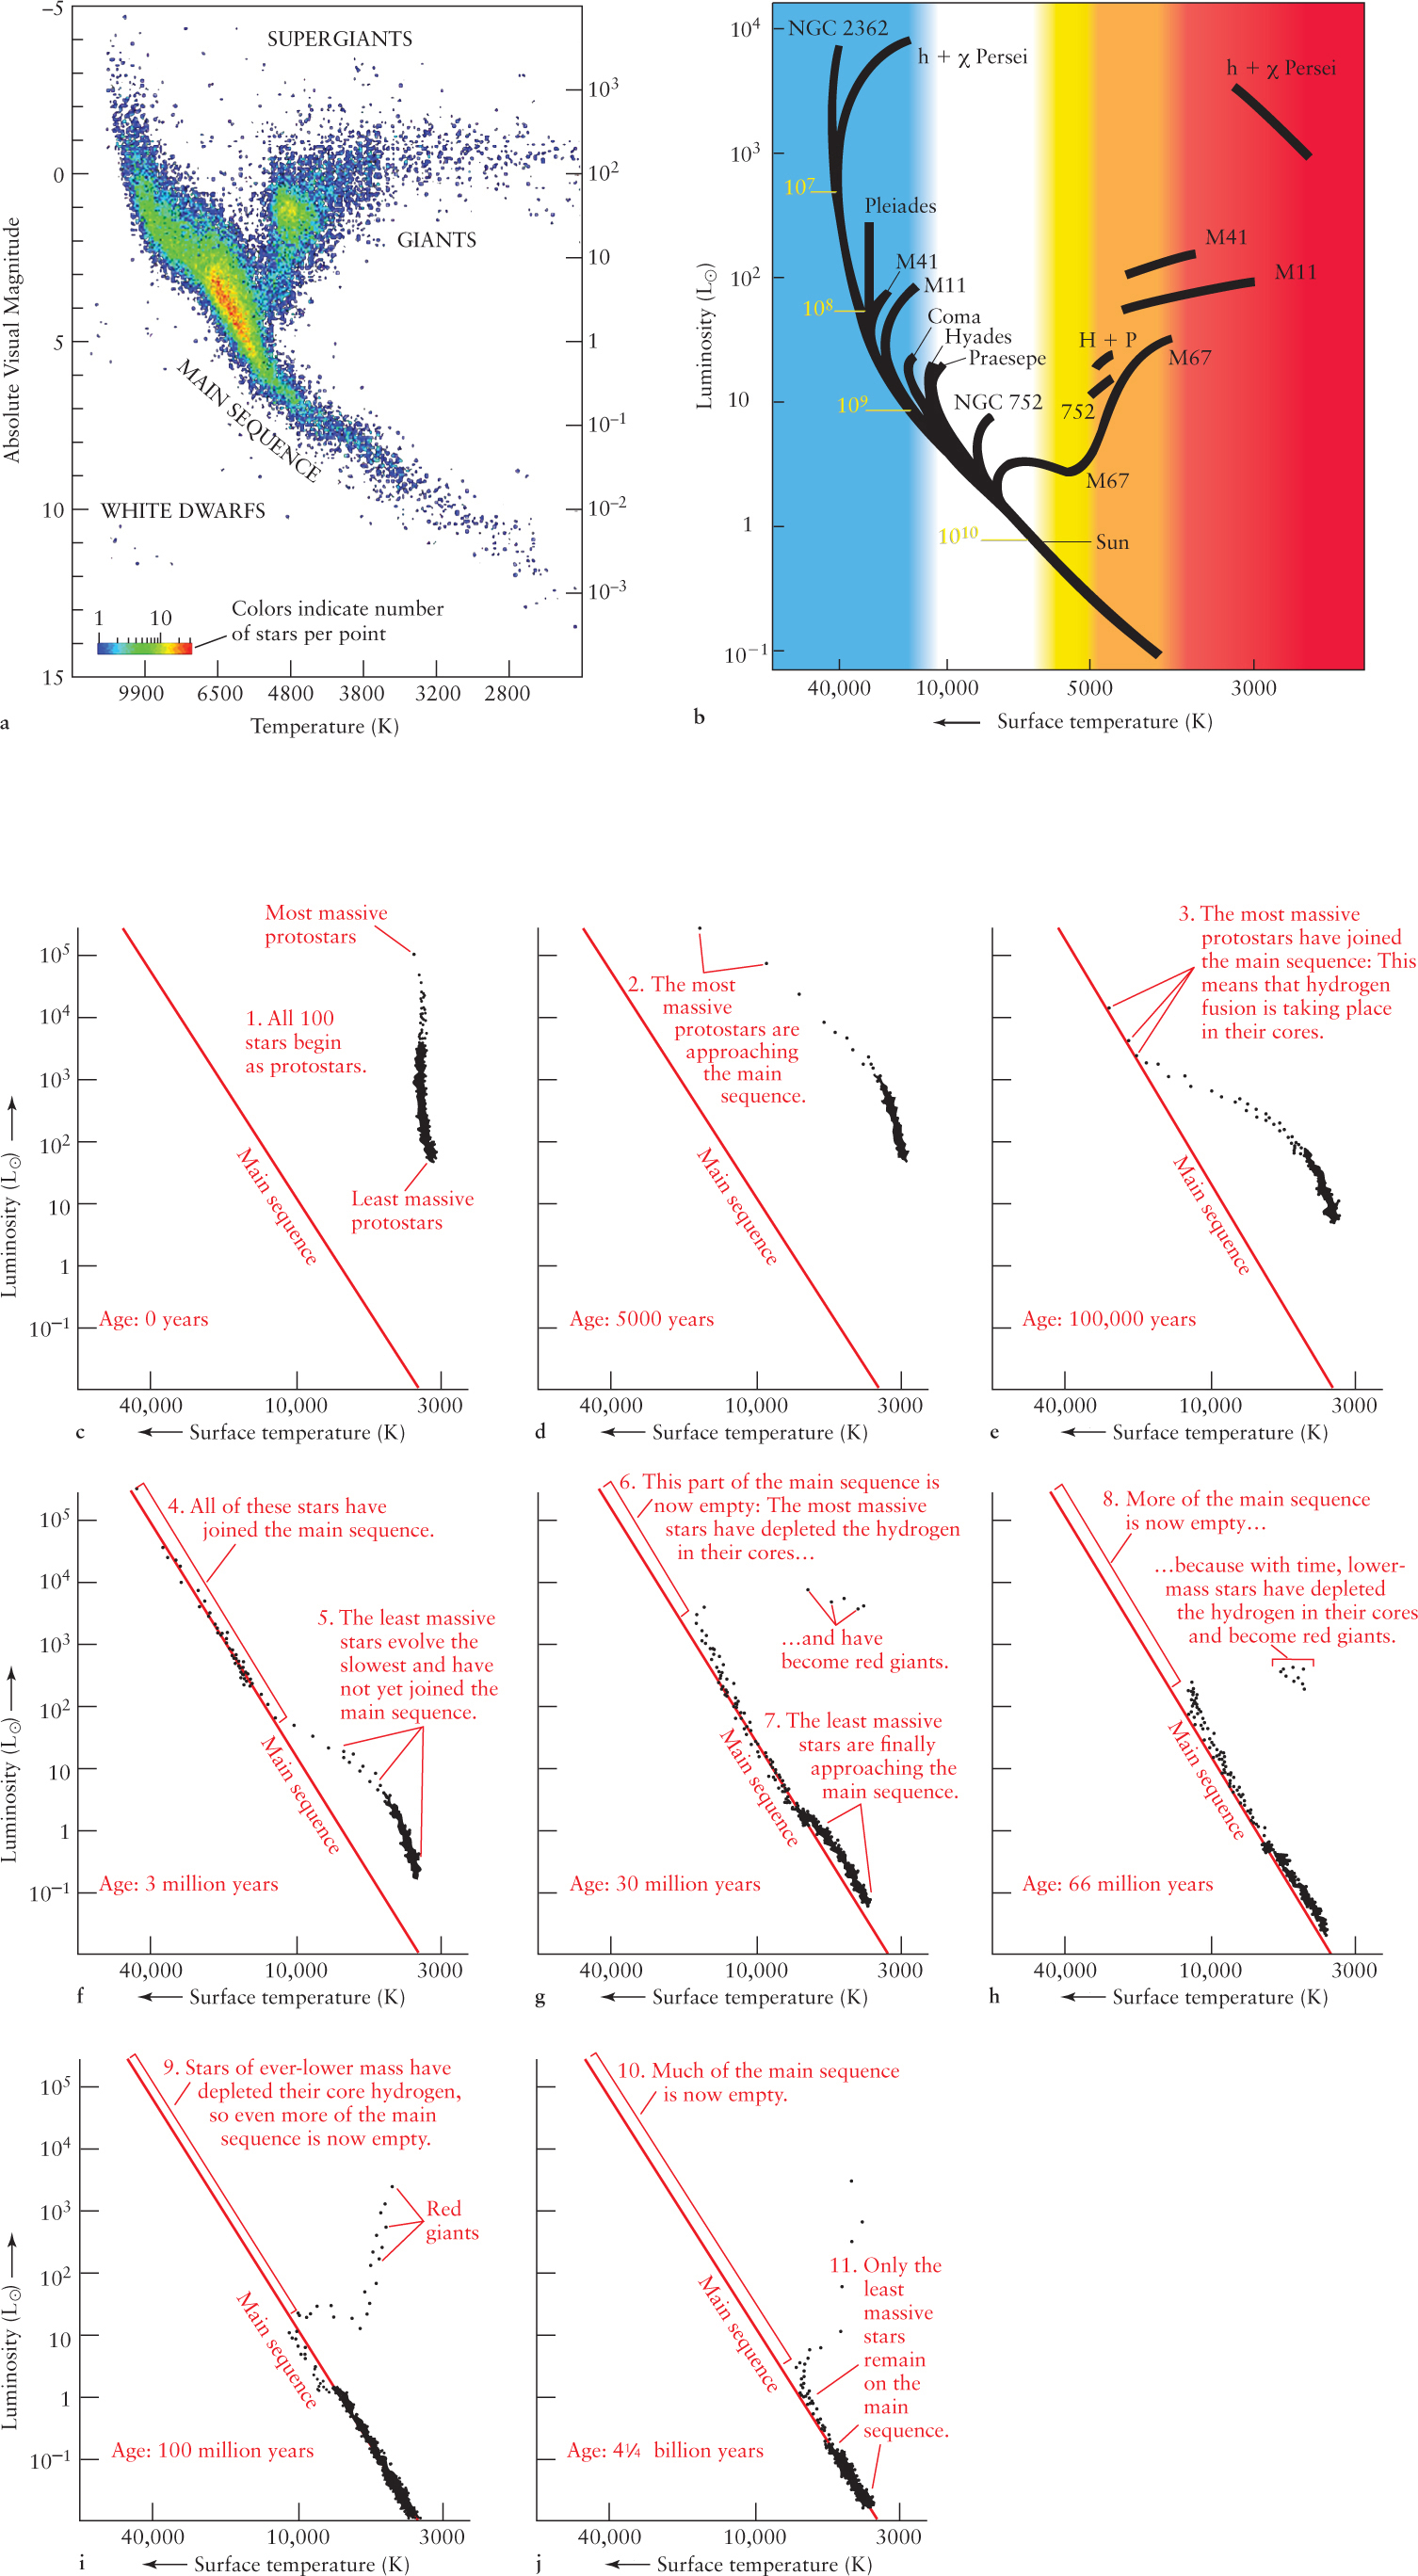
 Structure of the H-R Diagram (a) Data taken by the Hipparcos satellite placed 41,453 stars more precisely on the H-R diagram than any previous observations. This figure shows the overall structure of the H-R diagram. The thickness of the main sequence is due in large part to stars of different ages turning off the main sequence at different places, as shown in (b). (b) The black bands indicate where data from various star clusters fall on the H-R diagram. The ages of turnoff points (in years) are listed in yellow alongside the main sequence. The age of a cluster can be estimated from the location of the turnoff point, where the cluster’s most massive stars are just now leaving the main sequence.
(c–j) Summarizing the evolution of a theoretical cluster of 100 stars, as shown by their locations on the H-R diagram. (In principle, each star’s evolution could be followed separately.) After a star passes through the red giant phase, it is deleted from the diagram.
Until recently, astronomers believed that all globular clusters were very old, with turnoff points as just described. However, analysis of some clusters, especially Westerlund 1, discovered in 2004, suggest that globular clusters are still forming. Westerlund 1, located in our Galaxy, contains roughly half a million stars in a volume only 6 light-years across, including at least 200 O and B stars. The presence of such high mass stars implies that Westerlund 1 is only about 5 million years old. This cluster is called a superstar cluster. Such clusters are believed to be early stages in the lives of globular clusters. Superstar clusters have been observed in other galaxies (see, for example, the figure opening this chapter).
While most globular clusters contain many of the oldest stars in our Galaxy, the youngest stars in the Milky Way are found in its open clusters. Unlike globular clusters, which are spherically distributed around the center of the Milky Way, our Galaxy’s open clusters lie in the plane of the Galaxy, that is, along the band of light sweeping majestically across the night sky.
Stars in open clusters are said to be metal-rich, because their spectra contain many prominent spectral lines of heavy elements. This material originally came from stars that exploded long ago, enriching the interstellar gases with the heavy elements formed in their cores. The young, open clusters are therefore formed from the debris of older generations of stars. The Sun is an example of a young, metal-rich star that was likely formed in an open cluster. Such stars are called Population I stars.
395
396
Older globular clusters are generally located above or below the plane of our Galaxy. Because their spectra show only weak lines of heavy elements, the ancient stars in these clusters are said to be metal-poor. They were created long ago from gases that had not yet been substantially enriched with heavy elements, and are called Population II stars. Figure 12-32 compares the spectra of a Population II star and the Sun. As we saw for Cepheid variable stars (see Figure 12-28), differences in chemistries can affect stellar evolution.

12-15 Mass transfer in close binary systems can produce unusual double stars
Some stars substantially change their masses over time and thereby alter the patterns of their evolution. This occurs for stars in binary systems that are sufficiently close to each other (see Chapter 11). In the mid-1800s, French mathematician Édouard Roche (1820–1883) pointed out that the atmospheres of two stars in a binary system must remain within a pair of teardrop-shaped regions that surround the stars. Otherwise, the gas escapes from the star of its origin, either transferring to the other star, where the teardrops make contact, or escaping completely from the binary in the opposite direction. In cross-section, these so-called Roche lobes take on a figure-eight shape (dashed lines in Figure 12-33). The more massive star is always located inside the larger Roche lobe.
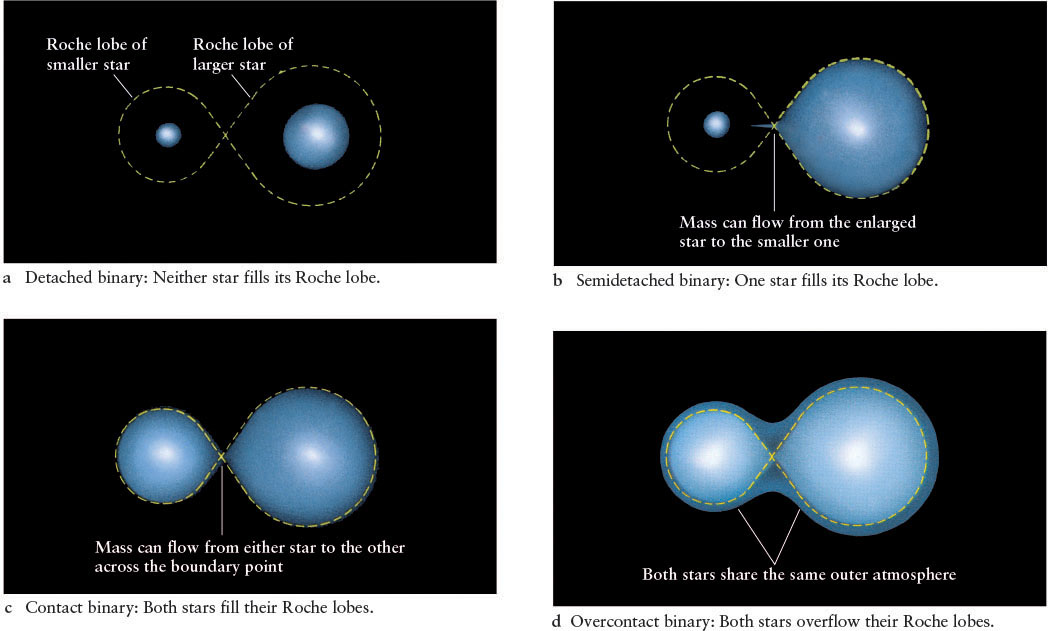
The stars in many binaries are so far apart that, even during their giant stages, the stars’ surfaces remain well inside their Roche lobes. Other than orbiting one another, each star in such systems lives out its life cycle as if it were single and isolated, and the system is referred to as a detached binary (see Figure 12-33a). If two stars are relatively close together, however, one star may fill or overflow its Roche lobe as it expands into the giant phase. This system is a semidetached binary, and gases then flow across the point where the two Roche lobes touch and fall onto the companion star (Figure 12-33b). When both stars completely fill their Roche lobes, the system is a contact binary, because the two stars actually touch and exchange gas (Figure 12-33c). It is quite unlikely, however, that both stars will exactly fill their Roche lobes at the same time. It is more likely that they overflow their lobes, giving rise to a common atmospheric envelope. Such a system is an overcontact binary (Figure 12-33d).
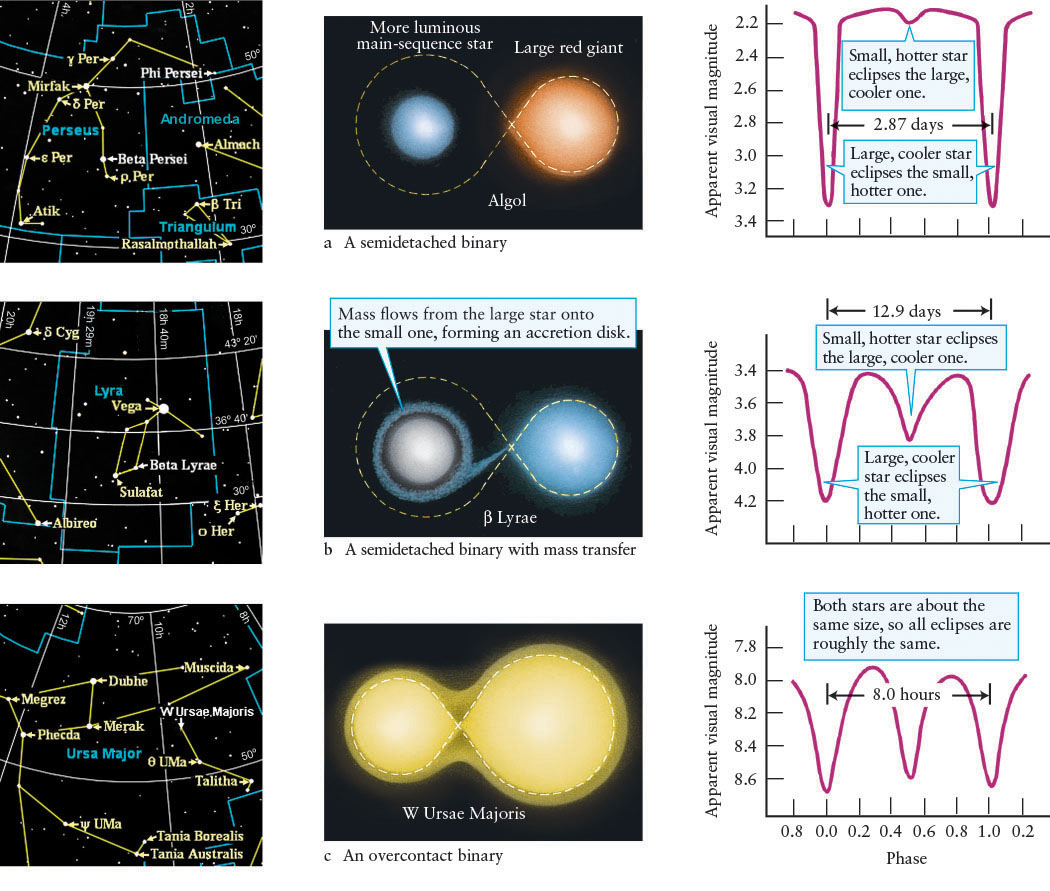
Semidetached and contact binaries are easiest to detect if they are also eclipsing binaries (recall Figure 11-13). Their light curves have a distinctly rounded appearance, caused by these tidally distorted egg-shaped stars. The eclipsing binary β (beta) Persei, commonly called Algol (from the Arabic term for “demon”), is a semidetached binary that can easily be seen with the naked eye in the constellation Perseus. From Algol’s light curve (Figure 12-34a), astronomers have determined that the binary contains a star that fills its Roche lobe. Sometime in the past, as it expanded and became a giant, this star dumped a significant amount of gas onto its companion.
397
Mass transfer is still occurring in a semidetached eclipsing binary, called β Lyrae, in the constellation Lyra. Like β Persei, β Lyrae contains a giant that fills its Roche lobe (Figure 12-34b). For many years, astronomers were puzzled as to why the detached companion star in β Lyrae is severely underluminous, contributing virtually no light at all to the visible radiation coming from the system. Furthermore, the spectrum of β Lyrae contains unusual features, some of which are consistent with gas flowing between the stars and around the system as a whole.
The β Lyrae system was explained in 1963, when the Chinese-American astronomer Su-Shu Huang (1915–1977) proposed that the underluminous star in β Lyrae is enveloped in a huge accretion disk of gas captured from its bloated companion. The disk is so large and thick that it completely enshrouds the secondary star, making it impossible to observe at visible wavelengths. Observations indicate that the primary star is overflowing its Roche lobe, with gases streaming onto the disk at the rate of 1 M⊙ per hundred thousand years.
The fate of a semidetached system like β Persei or β Lyrae depends primarily on how fast its stars evolve. If the detached star expands to fill its Roche lobe while the companion star fills its own Roche lobe, then the result is an overcontact binary. An example is W Ursae Majoris, in which two stars share the same photosphere (Figure 12-34c).
Margin Question 12-15
Question
In which type of binary system are the two stars most actively exchanging mass?
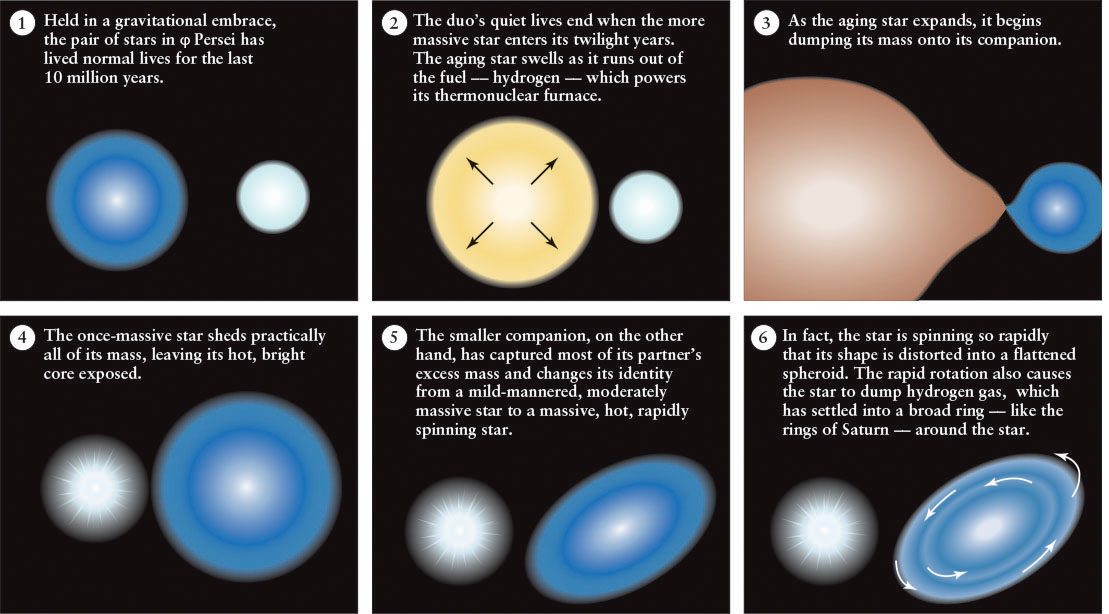
Theories of the evolution of binary systems that transfer mass reveal that some remarkable transformations are possible, such as the case of φ (phi) Persei. As shown in Figure 12-35, the more massive star in a binary can actually be transformed into the lower-mass star, and vice versa! When stars in such systems gain mass, their increased gravitational force increases their rate of fusion, which increases the rate at which they evolve. Conversely, the stars that lose mass begin evolving more slowly than before their mass loss. In Chapters 13 and 14, we will see that mass transfer produces some of the most extraordinary objects in the sky.
398
12-16 Frontiers yet to be discovered
Stars, whether isolated, in pairs, or in much larger groups, are our primary source of information about the universe. Details of each step of stellar evolution remain to be explored; the pre–main-sequence evolution of stars is being revealed in sources like the Eagle Nebula (see Figure 12-16). These observations provide data with which to compare the theories of early star formation. Over the past two decades, observations have revealed that more stars lose mass in the form of stellar winds while on the main sequence than previously expected. Consequently, we have a lot to learn about why such stars shed mass.
We still need to understand the details of how stars swell into the red giant phase. Also, the mechanisms that cause stars to be variable are still under investigation. This latter work has been stimulated recently by the asyet-unexplained observation that Betelgeuse has shrunk 15% in diameter since 1993. This is a huge change in size, equal to the distance between the Sun and Venus.
399