Low-Mass (0.4 M⊙–8 M⊙) Stars and Planetary Nebulae
We have seen that red dwarf stars, with masses less than 0.4M⊙, never get to the giant phase of stellar evolution. Rather, they convert all their mass to helium, stop fusing, and then just cool off. We will now explore the fates of stars greater than 0.4M⊙ as they proceed along through the giant phase and beyond.
In Chapter 12, we discovered that when hydrogen fusion in the shell surrounding the core first begins, the energy from it causes a star to expand and become a giant. During this process, low-mass stars move over to, and ascend, the giant branch on the H-R diagram for the first time (Figure 13-1a; see also Figure 12-25b). As this happens, mass is expelled into space in the form of stellar winds, which reduce the masses of these stars. Then core helium fusion begins, with stars of less than about 2 M⊙ undergoing a core helium flash in the giant stage (Figure 13-1a). Recall also that stars with more than 2 M⊙ begin helium fusion more gradually. In either case, after core fusion begins again, stars shrink and move onto the horizontal branch (Figure 13-1b).
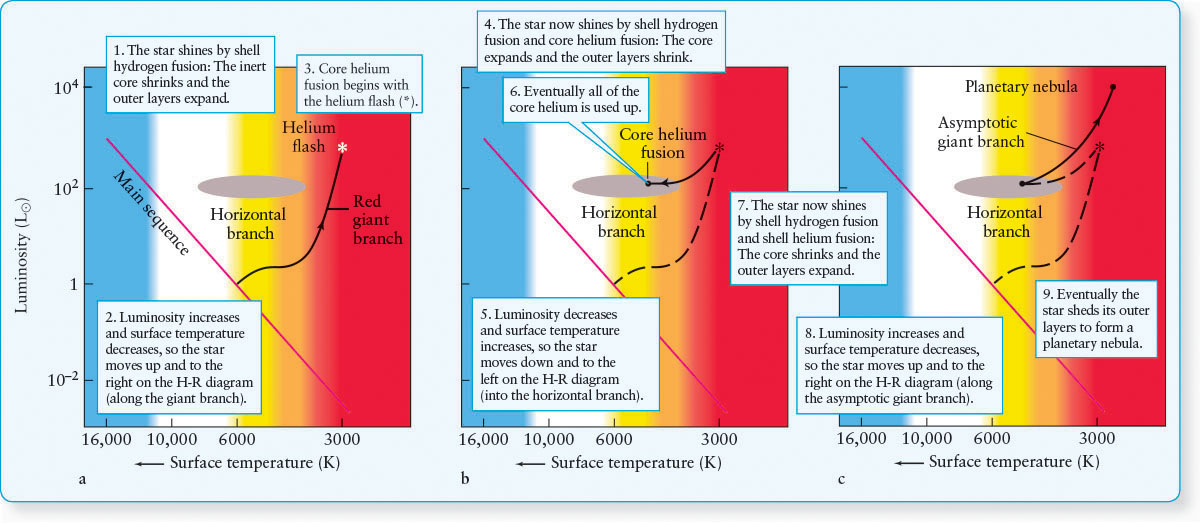
 Post–Main-Sequence Evolution of Low-Mass Stars (a) A typical evolutionary track on the H-R diagram as a star makes the transition from the main sequence to the giant phase. The asterisk (*) shows the helium flash occurring in a low-mass star. (b) After the helium flash, the star converts its helium core into carbon and oxygen. While doing so, its core reexpands, decreasing shell fusion. As a result, the star’s outer layers recontract. (c) After the helium core is completely transformed into carbon and oxygen, the core recollapses, and the outer layers reexpand, powered up the asymptotic giant branch by hydrogen shell fusion and helium shell fusion.
407
The destinies of stars depend on their masses, and we have two mass ranges to consider: 0.4 M⊙ to 8 M⊙ (hereafter, low-mass stars), and more than 8 M⊙ (hereafter, high-mass stars).
13-1 Low-mass stars become supergiants before expanding into planetary nebulae
Calculations reveal that carbon and oxygen atoms require a temperature of at least 600 million K to fuse. Because the core of a low-mass giant on the horizontal branch only reaches about 200 million K, fusion of these elements in the core does not occur. Photon production in the core therefore decreases when its helium fuel is nearly used up, and the inner regions of the star again contract. Just outside the core, the hydrogen shell fusion has created a shell of helium. As the core contracts, this helium follows it inward and is thereby compressed and heated until it reaches 100 million degrees K. At that temperature, helium shell fusion begins in what used to be the realm of hydrogen shell fusion. This shell is itself surrounded by a new hydrogen-fusing shell (Figure 13-2). All of this takes place within a volume roughly the size of Earth.
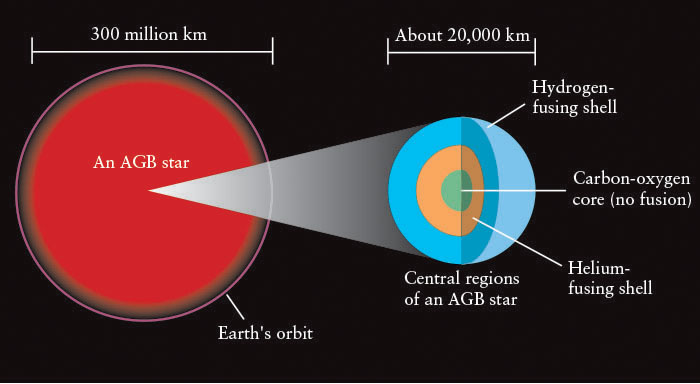
Once helium shell fusion commences, the new outpouring of energy again pushes the outer envelope of the star out. A low-mass star thus leaves the horizontal branch and ascends the H-R diagram for a second, and final, time (Figure 13-1c). Powered by the fusion from two shells, such an asymptotic giant branch star, or AGB star, becomes brighter than ever before. When the Sun moves along the asymptotic giant branch, it will expand to a radius of about 1 AU, enveloping Earth in its tenuous outer layers (Figure 13-2). An 8 M⊙ star will have a diameter as big as the orbit of Mars and shine with the luminosity of 104 L⊙. At the top of the asymptotic giant branch, these stars are now so bright that they are classified as low-temperature, red supergiants (see Figure 13-1c).
AGB stars are destined to self-destruct. Giant stars of all spectral types emit strong stellar winds. Low-mass stars expel their outer layers more slowly than higher-mass stars, but both types of stars reduce their masses significantly from what they were on the main sequence. During their initial ascent up the giant branch, stars can lose as much as 30% of their masses. On the asymptotic giant branch, stars lose even more, often surrounding themselves with thickening cocoons of gas and dust. A star of the Sun’s mass loses about 10−5 M⊙ per year at this stage, eventually dumping half of its mass back into space.
This mass loss limits the force of gravity available to compress the star’s core and the regions of shell fusion. A fine balance is struck: The low-mass AGB star is compressed until its core of carbon and oxygen becomes degenerate, meaning that the electrons provide a growing repulsive force that stops its contraction (as discussed in Section 12-10). However, even in the most massive of these low-mass stars (now much less than their original 8M⊙ due to their stellar winds), the core temperature cannot reach the 600 million K necessary to fuse carbon or oxygen. Therefore, no further core fusion occurs.
The final stage through which a low-mass star passes begins with a “thermal runaway” (meaning a rapid rise in temperature) in the helium shell, just like the helium flash in its core earlier in its life (described in Section 12-10). This process occurs because the triple alpha process (see Section 12-11) is extremely sensitive to temperature, and, as the temperature goes up slightly, the fusion rate skyrockets. The increase in energy output from the thin helium-fusing shell, called a helium shell flash, expands the star, thereby briefly decreasing the temperature in the shell and slowing the rate of fusion.
A star in this mass range undergoes several helium shell flashes as its helium shell thickens. During each flash, the helium shell’s energy output jumps a thousandfold. These brief outbursts are separated by relatively quiet intervals lasting about 100,000 years, during which the helium shell gradually becomes thicker. The energy from the increased fusion during the helium shell flashes causes the star’s outer layers to expand and, therefore, cool further. Eventually, the outer gases are sufficiently cool so that electrons and ions in them can recombine. This process is exactly the opposite of ionization (discussed in Section 4-5). Whereas ionization requires an electron to absorb a photon, recombination forces an electron to emit a photon.
408
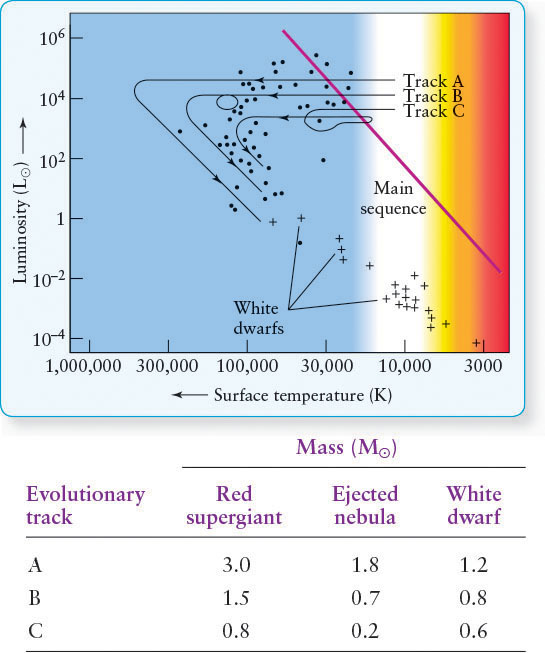
Just as the collisions of particles with each other create pressure (force acting over an area), the collisions of photons with matter also create pressure. The impacts of photons emitted during recombination, along with the photons from the helium flashes and the photons normally flowing outward from fusion, generate enough pressure to eject more and more of the star’s outer layers into space. Eventually, the mass of the star decreases so much that there is not enough pressure to sustain any shell fusion. As the ejected material expands and cools, some of it condenses to form dust grains. When enough of the gas has left the star for the core to be visible, the expanding dust and gases are considered to be a planetary nebula (see Figure 13-1c). As the outer layers of the star are shed, an increasingly hot interior is revealed, and the star moves to the left across the H-R diagram (Figure 13-3). Including the mass lost prior to the planetary nebula phase, low-mass stars lose as much as 80% of their mass by shedding their outer layers.
Margin Question 13-1
Question
What luminosity class will the Sun be in just before it becomes a planetary nebula?
Names Often Don’t Change as Understanding Improves
Planetary nebulae have nothing to do with planets. This term was coined by the astronomer William Herschel in the eighteenth century. When viewed through the telescopes of the day, these glowing objects, often green in appearance, looked like planets similar to Uranus. Astronomers have continued to use this term, but do not be fooled—we now know that planetary nebulae indicate the presence of dying stars, not planets.
 Planetary nebulae are quite common in our Galaxy. More than 3000 have been identified, and astronomers estimate that 20,000 to 100,000 planetary nebulae exist in the Milky Way. Indeed, the fate of the Sun is to shed its outer layers as a planetary nebula. The rate at which the gases are removed in a planetary nebula is so slow that they really are not explosive, compared either to our common conception of an explosion on Earth or to the supernova explosions that we will examine shortly.
Because stellar winds from red giants and subsequent planetary nebulae are so plentiful, astronomers estimate that they return a total of about 5 M⊙ per year of gas and dust to the disk of our Galaxy. This mass amounts to about 85% of all matter expelled by all types of stars. This material goes into the formation of new, metal-rich Population I stars, along with their associated planets and debris. Thus, planetary nebulae play an important role in the chemical and physical evolution of the Galaxy.
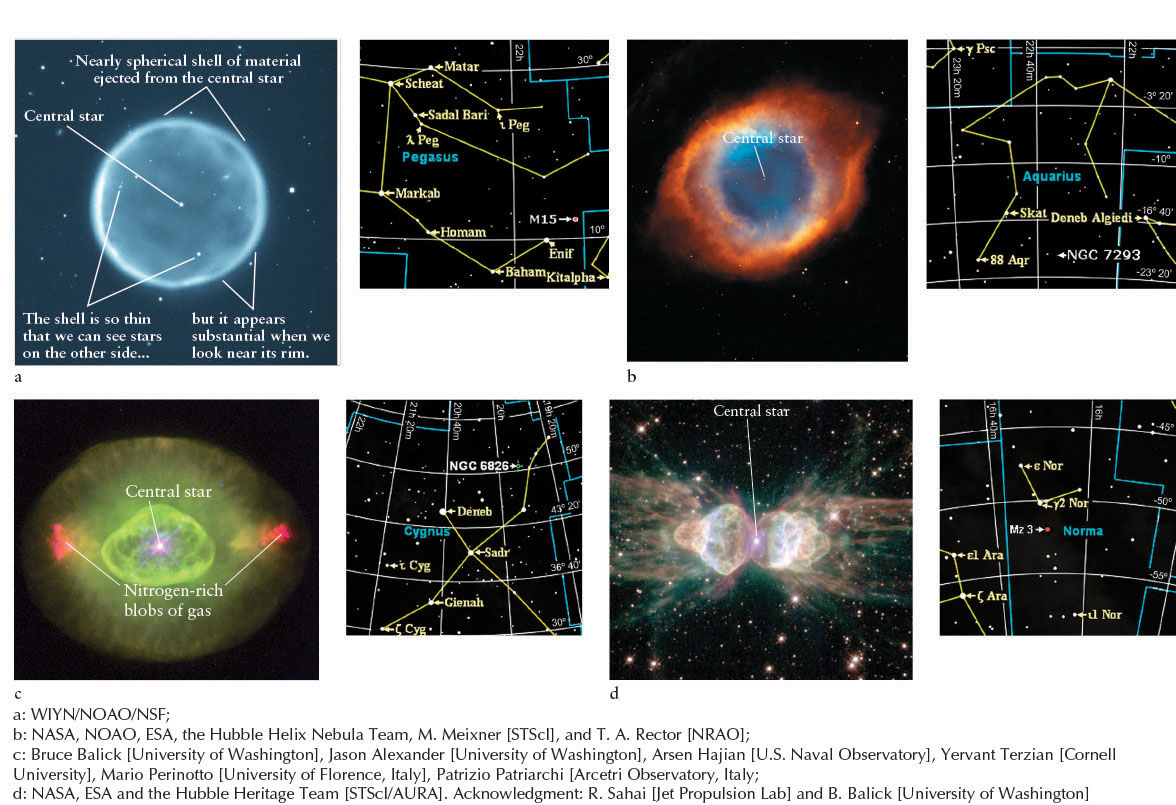
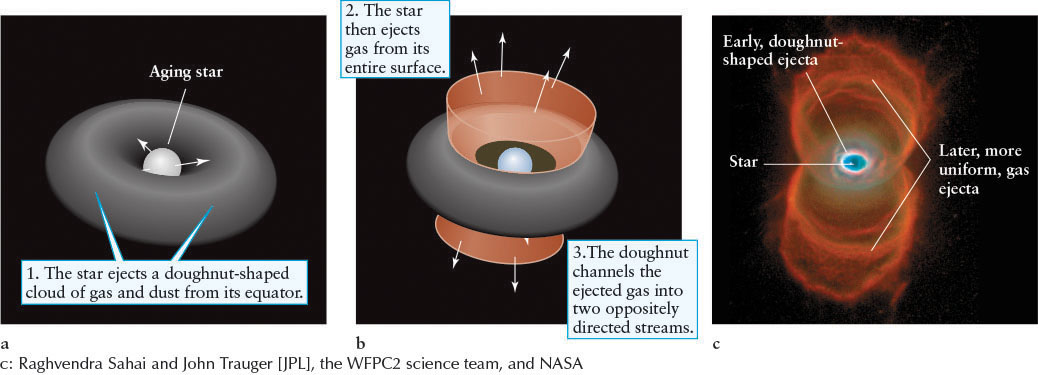
The outflowing gases ejected in a planetary nebula take a breathtaking variety of shapes when they interact with gases surrounding their stars, with companion stars, and with the stars’ magnetic fields, which are often 10 to 100 times stronger than the Sun’s field (Figure 13-4 and Figure 13-5). The Hourglass Nebula (Figure 13-5c) appears initially to have shed mass in a doughnut shape around itself. In the star’s final death throes, this gas and dust forced the outflow to go in two directions perpendicular to the plane of the doughnut, creating what is called a bipolar planetary nebula.
Spectroscopic observations of planetary nebulae show bright emission lines of hydrogen, carbon, neon, magnesium, oxygen, and nitrogen. From the Doppler shifts of these lines, we conclude that the gas and dust are moving outward from dying low-mass stars at speeds of 10 to 30 km/s. A typical planetary nebula moving outward for 10,000 years has a diameter of a few light-years.
409
410
By astronomical standards, a planetary nebula is short-lived. After about 50,000 years, its gases have spread over distances so far from the cooling central star that its nebulosity simply fades from view. The gases then mingle and mix with the surrounding interstellar medium, enriching it with some relatively low-mass elements, such as helium, carbon, oxygen, and nitrogen.
13-2 The burned-out core of a low-mass star becomes a white dwarf
The exposed carbon-oxygen cores of low-mass stars are stable objects supported by electron degeneracy pressure. Such burned-out hulks are called white dwarfs, and this is the fate of the Sun’s core. Typical white dwarfs are roughly the size of Earth and are covered with a thin coating of hydrogen and helium. Atmospheres also surround them. Spectra of several white dwarf atmospheres contain elements consistent with Earthlike planets having been vaporized in them. The densities of white dwarfs are typically 109 kg/m3. In other words, a teaspoonful of white dwarf matter brought to Earth would weigh 5 tons.
Margin Question 13-2
Question
Of what two elements is a white dwarf composed?
Theoretical evolutionary tracks of three burned-out stellar cores are shown in Figure 13-3. These particular white dwarfs evolved from main-sequence stars of between 0.8 M⊙ and 3.0 M⊙. During the ejection phase, the appearance of these remnants changes rapidly. They appear to race along their evolutionary tracks on the H-R diagram, sometimes executing loops called thermal pulses as they temporarily reheat (tracks B and C in Figure 13-3). Finally, as the ejected planetary nebulae fade and the stellar cores cool, the evolutionary tracks of the dying stars take a sharp turn downward toward the white dwarf region of the diagram.
As billions of years pass, an isolated white dwarf radiates its stored energy into space, cooling and decreasing in luminosity. It moves down and to the right on the H-R diagram. The Sun will become a cold, dark, dense sphere of degenerate gases, primarily carbon and oxygen, about the size of Earth. We can actually follow the theory a little further. Astronomers predict that after billions of years of radiating away their heat, the interior temperatures of white dwarfs will decrease to about 4000 K, and the carbon and oxygen in them will solidify, transforming them into giant crystals.
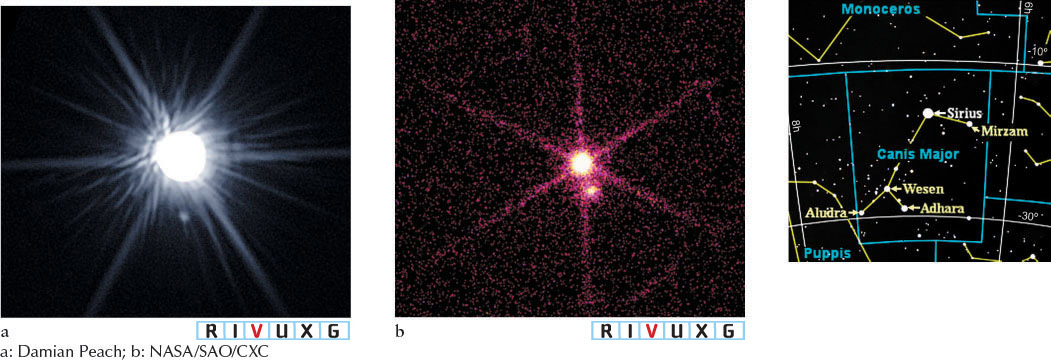
Many white dwarfs are found in our solar neighborhood, but all are too faint to be seen with the naked eye. The first white dwarf to be discovered is a companion to the bright star Sirius. The binary nature of Sirius was first deduced in 1844 by the German astronomer Friedrich Bessel (1784–1846), who noticed that the star was moving back and forth, as if orbited by an unseen object. This companion, Sirius B (Figure 13-6), was first glimpsed in 1862. Recent satellite observations at ultraviolet wavelengths—where white dwarfs emit most of their light—demonstrate that the surface temperature of Sirius B is about 30,000 K.
13-3 White dwarfs in close binary systems can create powerful explosions
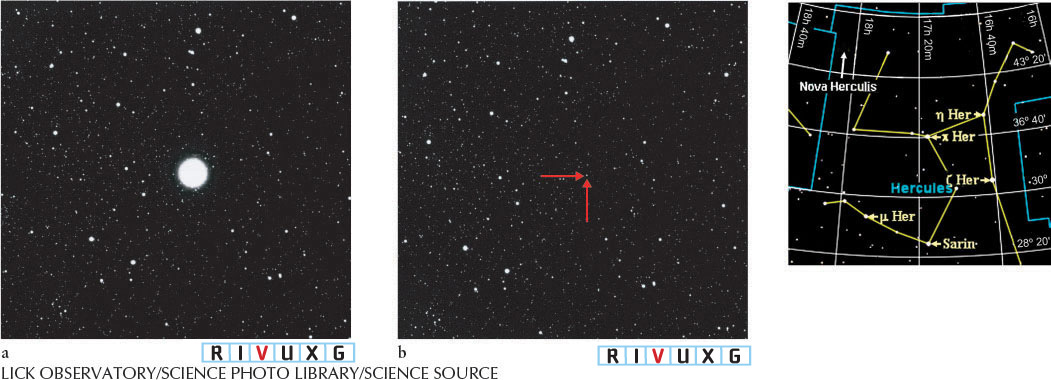
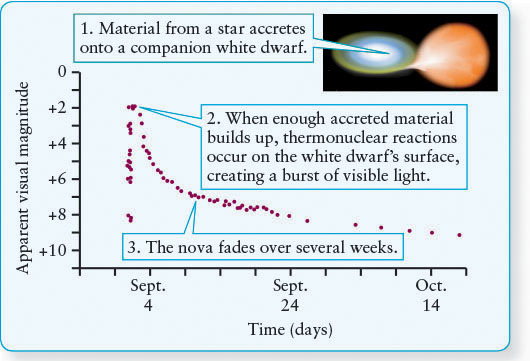
Occasionally, a star in the sky suddenly becomes between 104 and 106 times brighter than it is normally. This phenomenon is called a nova. Its abrupt rise in brightness is followed by a gradual decline that may stretch over several months or more (Figures 13-7 and 13-8). Astronomers typically observe two or three novae in our Galaxy each year. Novae are fairly common, with about 20 estimated to occur in the Milky Way Galaxy annually. We do not see all of them because of the interstellar gas and dust that obscures many parts of the Galaxy.
411
 Painstaking observations strongly suggest that novae occur in close binary systems that contain a white dwarf. The ordinary companion star fills its Roche lobe (recall Figures 12-33, 12-34, and 12-35), so it gradually deposits fresh hydrogen onto the white dwarf. This new mass becomes a dense layer covering the hot surface of the white dwarf. As more gas is deposited and compressed, the temperature in the hydrogen layer continues to increase. Finally, at about 107 K, hydrogen fusion ignites throughout the layer, blowing it into interstellar space. This explosion is the nova. After a nova, fusion ceases on the white dwarf. The companion star, however, may retain enough mass to supply a new layer of surface hydrogen, enabling some novae to reoccur. White dwarfs are not damaged by novae initiated on their surfaces.
Recent visible observations by the Hubble Space Telescope and X-ray observations by the Chandra X-ray Observatory reveal that novae are much more complex than astronomers had thought. Rather than smooth shells of expanding gas, they are composed of thousands of clumps of gas. These observations are stimulating astrophysicists to reexamine the details of the nova mechanism described above to include these newly observed effects.
Margin Question 13-3
Question
Why are novae not associated with isolated white dwarfs?
Theoretical models predict that degenerate matter, such as the electrons in a white dwarf, can withstand only a finite amount of pressure, above which the degenerate matter cannot exert enough outward force to prevent the core from collapsing further. This limits the mass of a white dwarf to less than 1.4 M⊙. This mass is called the Chandrasekhar limit, after the astrophysicist Subrahmanyan Chandrasekhar (1910–1995), who received a Nobel Prize in 1983 for his pioneering theoretical studies of white dwarfs a half-century earlier.
13-4 Accreting white dwarfs in close binary systems can also explode as Type Ia supernovae
 Whereas a nova only removes hydrogen and helium that build up on the surface of a white dwarf, some of these stellar remnants actually blow apart completely. This event is called a Type Ia supernova, and it occurs in white dwarfs that are part of semidetached binary systems. To trigger most Type Ia supernovae, a companion star dumps gas onto a white dwarf that is close to the Chandrasekhar limit. When the added gas causes the white dwarf’s mass to cross that limit, the increased pressure deep inside the dwarf enables carbon fusion to begin in the core. In a catastrophic runaway process reminiscent of the helium flash, the rate of carbon fusion skyrockets, and with no outer layers to absorb the energy, the star blows up.
412
In most cases, the companion star survives the massive explosion to some degree. If the companion were a giant or supergiant, the supernova would make the gas in the companion’s outer layers glow much more brightly than is actually seen around young Type Ia supernova remnants. Therefore, astronomers believe that the companion stars are main-sequence stars similar to our Sun, because their afterglows from the supernova would be much dimmer than would occur if they were giants or supergiants. In 2012, astronomers reported observing a Type Ia supernova with no afterglow at all from a companion, leading to the deduction that some of these supernovae occur when two white dwarfs in a binary system spiral together and either collide or have the more massive white dwarf pull off the outer layers of the less massive one. In either case, the mass exceeds the Chandrasekhar limit and the white dwarf explodes.
A Type Ia supernova is powered by nuclear energy. What we see is the fallout from a gigantic thermonuclear explosion, which produces a wide array of elements, including silicon, calcium, sulfur, iron, cobalt, and nickel. Especially abundant is a radioactive (unstable) isotope of nickel that decays into a radioactive isotope of cobalt. Most of the electromagnetic display of a Type Ia supernova results directly from the radioactive decay of this nickel and cobalt.
A Type Ia supernova’s spectrum lacks hydrogen lines because the white dwarf from which it came was virtually free of this element. The light curve of the supernova, which shows its change of brightness over time, begins with a sudden rise (Figure 13-9). The supernova typically reaches an absolute magnitude of −19 at peak brightness and then declines gradually for more than a year.
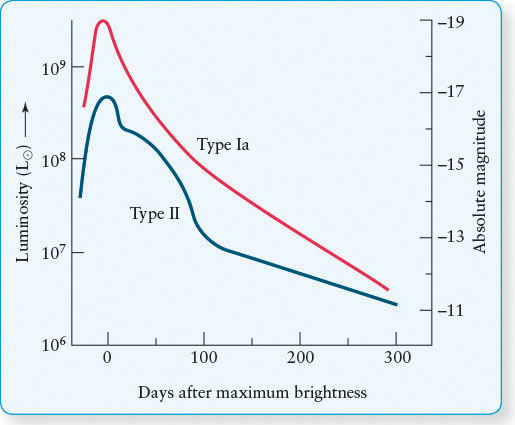
 Supernova Light Curves A Type Ia supernova, which gradually declines in brightness, is caused by an exploding white dwarf in a close binary system. A Type II supernova is caused by the explosive death of a massive star and usually has alternating intervals of steep and gradual declines in brightness.
Because these supernovae are so bright, they can be seen far beyond the bounds of the Milky Way. Whereas our Galaxy is about 105 ly in diameter, Type Ia supernovae can be seen in other galaxies at distances of over 109 ly away. Because they all peak at the same absolute magnitude, these supernovae are used to determine distances to myriad galaxies throughout the universe. This calculation is done in two steps. First, the apparent magnitude of a Type Ia supernova at its peak brightness is observed. Second, because we know its absolute magnitude, we use the distance-magnitude relationship (see An Astronomer’s Toolbox 11-3) to calculate its distance.