The Structure of Our Galaxy and Our Place In It
Because the band of the Milky Way completely encircles us, astronomers long ago suspected that the Sun and all of the stars that we see are part of it. In the 1780s, William Herschel took the first steps toward mapping our Galaxy’s structure. He attempted to deduce the Sun’s location in the Galaxy by counting the number of stars in 683 regions of the sky. He reasoned that the greatest density of stars should be seen toward the Galaxy’s center and a lesser density seen toward the edge. However, Herschel found roughly the same density of stars all along the Milky Way. He therefore concluded that we are at the center of the Galaxy.
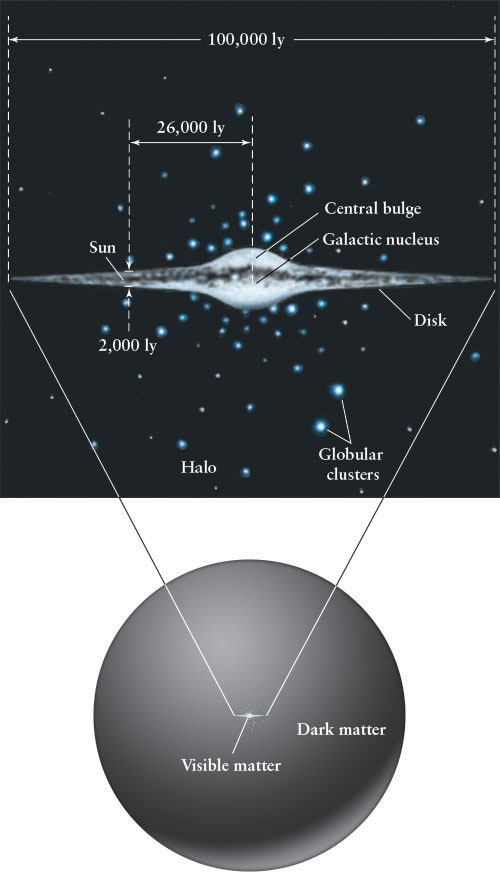
Herschel was wrong: Earth has no privileged place in the Milky Way. As we will now see, the Sun is about 26,000 ly (8000 pc) from the Galaxy’s center, the galactic nucleus. Herschel’s physical understanding of the cosmos was incomplete, so he misinterpreted his observations and thus came to an incorrect conclusion.
15-2 Cepheid variables help us locate our Galaxy’s center
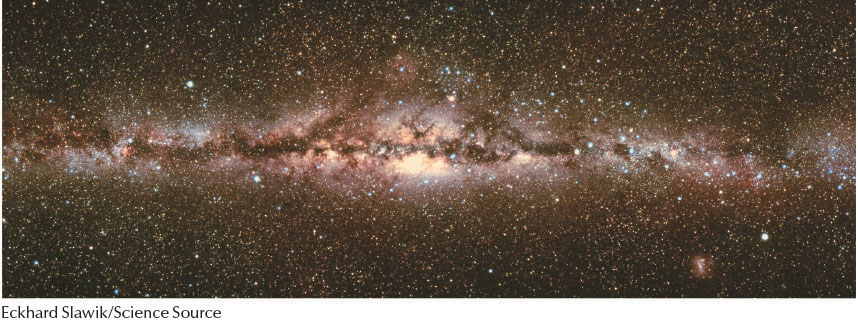
While studying star clusters in the 1930s, Robert Trumpler (1886–1956) discovered the reason for Herschel’s mistake. Herschel did not know about interstellar gas and dust, which affected his counts of the stars. Trumpler noticed that remote star clusters appear dimmer than would be expected just from their distance alone. Something must be blocking starlight on its way toward Earth. He correctly concluded that interstellar space is not a perfect vacuum. Instead, it contains dust that absorbs light from distant stars. Great patches of this dust are clearly visible in wide-angle photographs (Figure 15-5). Like the stars, this dust is concentrated in the plane of the Galaxy.
467
A Little Knowledge
Incomplete information often leads to incorrect interpretation of data and, therefore, to incorrect conclusions. Herschel’s lack of knowledge about the matter in interstellar space prevented him from correctly interpreting the distribution of stars that surround Earth and, thus, led to his inaccurate conclusion about the position of the Sun within the Galaxy.
This interstellar dust almost completely obscures from view visible light emanating from the center of our Galaxy. Visual photons from there are mostly absorbed or scattered before they reach us. Therefore, Herschel was seeing only nearby stars, and he measured apparent magnitudes that were dimmer than they would have been had there been no interstellar dust. Without adjusting for its effects, he concluded that the stars were farther away than they really are. He also had no idea of the true size of the Galaxy and could not see the vast number of stars located in the general direction of the galactic center that are hidden by the dust.
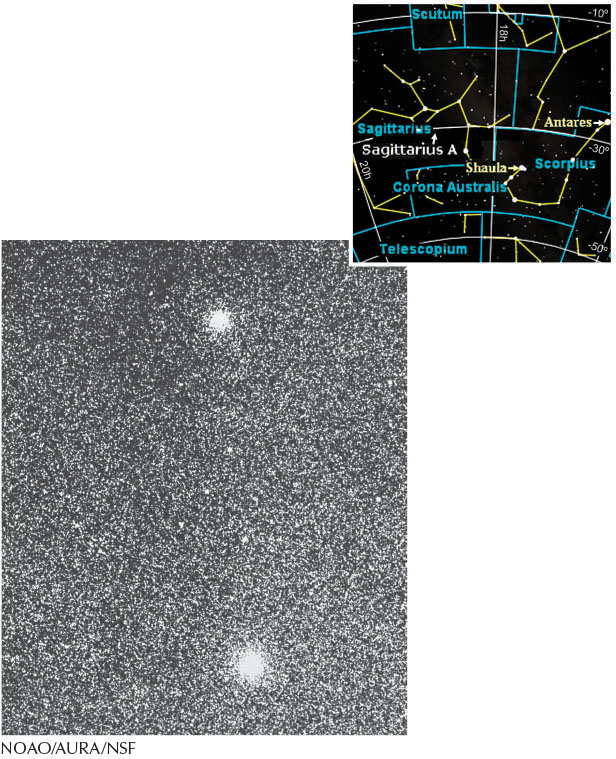
Because interstellar dust is concentrated in the plane of our Galaxy’s disk, the absorption of starlight is strongest in those parts of the sky covered by the Milky Way. Above or below the plane of the Galaxy, our view is relatively unobscured. Knowledge of our true position in the Galaxy eventually came from observations of globular clusters (see Section 12-14). Shapley used the period–luminosity relation for Cepheid variable stars to determine the distances to the then-known 93 globular clusters in the sky. (More than 150 are known today.) From their directions and distances, he mapped out the distribution of these clusters in three-dimensional space. By 1917, Shapley had discovered that the globular clusters are located in a spherical distribution centered not on Earth but on a point in the Milky Way toward the constellation Sagittarius. Figure 15-6 shows two globular clusters in a relatively clear part of the sky in that direction. Shapley then made a bold conjecture: The globular clusters orbit the center of the Milky Way, which is located in Sagittarius. His pioneering research has since been observationally verified. Earth is not at the center of the Galaxy.
15-3 Nonvisible observations help map the galactic disk
Margin Question 15-2
Question
What situation(s) on Earth are analogous to the obscuration caused by interstellar gas and dust?
To see into the dust-filled plane of the Milky Way, astronomers use radio wave, infrared, X-ray, and gamma-ray telescopes (see Figure 3-37). These wavelengths are scattered much less by the interstellar gas and dust located throughout the Galaxy’s disk than are visible or ultraviolet wavelengths. Observations of the distant parts of the Galaxy were first made using radio telescopes. Radio waves penetrate Earth’s atmosphere, so we can observe them anywhere that we can build a radio telescope. (Recall that infrared observations must be made at high altitudes or in space, and that X-ray and gamma-ray observations are almost always made from space.)
Detecting the radio emission directly from interstellar hydrogen—by far the most abundant element in the universe—is a primary means of mapping the Galaxy. Unfortunately, the major transitions of electrons in the hydrogen atom (see Figure 4-11) produce photons at ultraviolet and visible wavelengths that do not penetrate the interstellar medium. How, then, can radio telescopes directly detect all of this hydrogen? The answer lies in atomic physics.
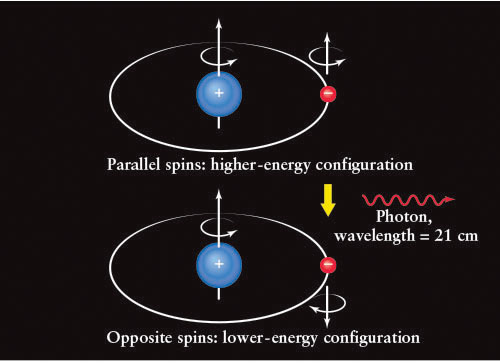
In addition to mass and charge, particles such as protons and electrons possess a tiny amount of angular momentum, commonly called spin. According to the laws of quantum mechanics, the electron and proton in a hydrogen atom can spin only in either parallel or opposite directions (Figure 15-7); they can have no other spin orientations. If the electron in a hydrogen atom flips from one orientation to the other, the atom must gain or lose a tiny amount of energy. In particular, when flipping from parallel to opposite spins, the atom simultaneously emits a low-energy radio photon whose wavelength is 21 cm. This flip happens rarely in each atom, so it is only because the Galaxy has vast quantities of interstellar hydrogen gas that it can be detected at all. In 1951, a team of astronomers first succeeded in detecting the faint hiss of 21-cm radio static from spin flips.
468
469
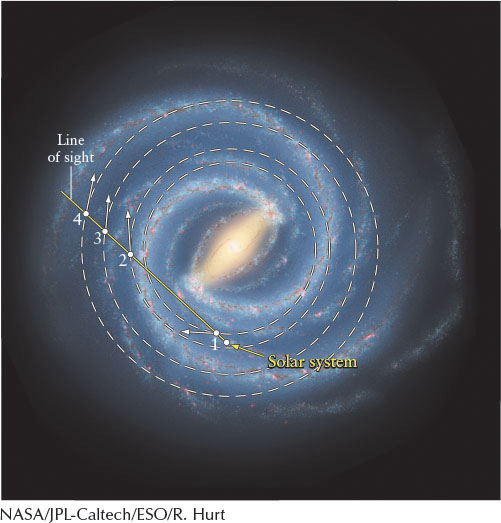
The detection of 21-cm radio radiation was a major breakthrough in mapping the disk of the Galaxy. To see why, suppose that you aim your radio telescope across the Galaxy, as sketched in Figure 15-8. Your radio receiver picks up 21-cm emission from hydrogen clouds at points 1, 2, 3, and 4. However, the radio waves from these various clouds are Doppler shifted (see An Astronomer’s Toolbox 4-3) by slightly different amounts because they have different radial velocities (motion toward or away from Earth). Because these radio waves from gas clouds in different parts of the Galaxy arrive at our radio telescopes with slightly different wavelengths as a result of being Doppler shifted, it is possible to identify which radio signals come from which gas clouds and thus to produce an initial map of the Galaxy, such as that shown in Figure 15-9a.
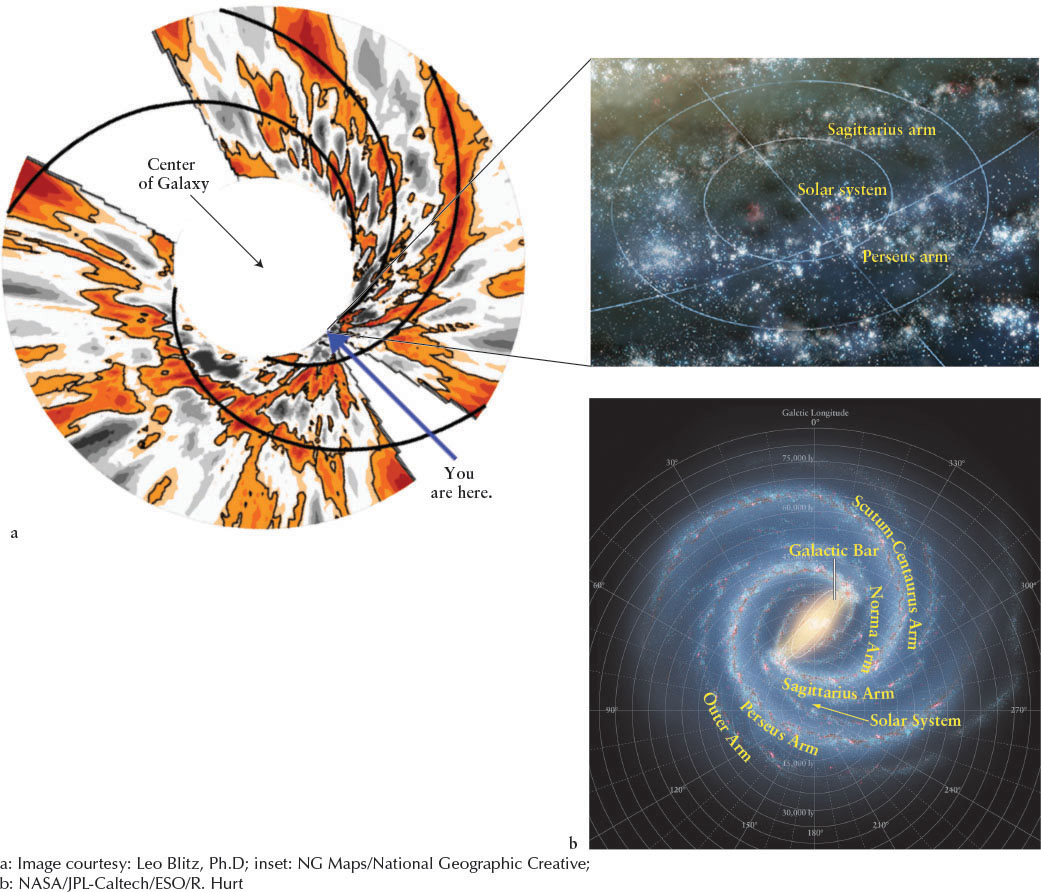
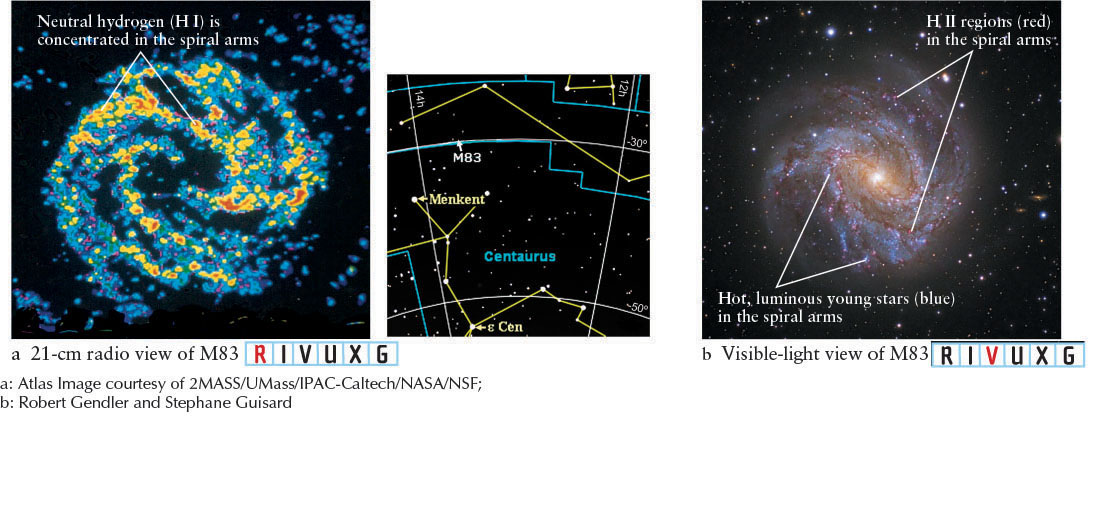
Our radio map reveals numerous arched lanes of neutral hydrogen gas. Analogous features are visible in the radio image of the barred spiral galaxy M83 (Figure 15-10a) If this were the overall structure of the Galaxy, then the Milky Way would appear unlike any other observed galaxy (see Chapter 16 for typical images of other galaxies). Indeed, the other disk-shaped galaxies we observe have spiral arms (Figure 15-10b). Different observations were needed to improve our understanding of our Galaxy’s disk features. Note that photographs of a barred spiral galaxy (Figure 15-10b) show arms outlined by “spiral tracers”—bright, Population I stars and emission nebulae. As we saw in Chapter 12, these features indicate active star formation. If the Milky Way is spiral, then another useful way to further chart its structure and show that it has spiral arms is to map the locations of star-forming complexes filled with H II regions, giant molecular clouds, and massive, hot, young stars in groups, called OB associations.
 Dust absorption limits the range of visual observations in the plane of the Galaxy to less than 24,000 ly from Earth. However, astronomers can use visible observations of nearby bright OB associations and associated H II regions to plot the spiral arms near the Sun (see Figure 15-9a inset). Radio observations of hydrogen and carbon monoxide molecules (discussed in Section 12-1) have been used to chart more remote star-forming regions of the Galaxy. Taken together, all of these observations indicate that our Galaxy has about 200 billion stars located in and between two major spiral arms and several minor arms (see Figure 15-9b). (Each arm is named after the constellation in which it is centered, as seen from Earth.) We will explore the origin of the spiral arms in Chapter 16, when we present more evidence about the cause of spiral structure from observations of other galaxies. Recent observations by the Spitzer Space Telescope confirm previous observations that a bar of stars and gas crosses the center of the Galaxy, also shown in Figure 15-9b. The stars, gas, and dust in the bar move down one side of it and then reverse direction and move back along the other side.
470
 The observable disk of our Galaxy is about 100,000 ly in diameter and about 2000 ly thick (Figure 15-11). Its two major spiral arms are designated the Perseus Arm and the Scutum-Centaurus Arm (see Figure 15-9b). There are also several less pronounced arms, including the Sagittarius Arm, the Norma Arm, the Local Arm, and the the Outer Arm. The solar system is located in the Local Arm (also called the Orion Spur), which appears to branch off the Perseus Arm. On the side toward the galactic center is the Sagittarius Arm, which stargazers in the northern hemisphere see in the summer when they look at the portion of the Milky Way stretching across Scorpius and Sagittarius (see Figure 15-5). Directed away from the galactic center is the Perseus Arm, which is visible in the northern hemisphere in the winter.
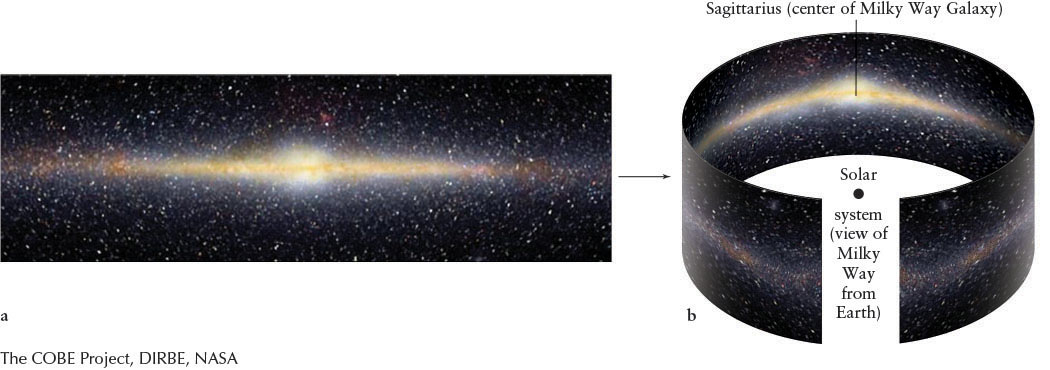
As noted above, observations reveal that the Galaxy’s arms spiral out from a bar of stars, gas, and dust (Figure 15-9b) running through a flattened sphere of stars, called the central bulge (also called the nuclear bulge), that is about 12,000 ly in diameter. The central bulge is also seen in Figure 15-12, a wide-angle infrared image of the Galaxy taken by the COBE satellite. The central bulge is centered on the galactic nucleus 26,000 ly away from us.
471
15-4 The galactic nucleus is an active, crowded place
If you lived on a planet near the center of the Galaxy, which is called the galactic nucleus, you would see a million stars as bright as Betelgeuse appears from Earth today. The total intensity of starlight from all those nearby stars would be equivalent to 200 of our full Moons. Night would never really fall. Stranger still, the Galaxy around you would be filled with intense activity.
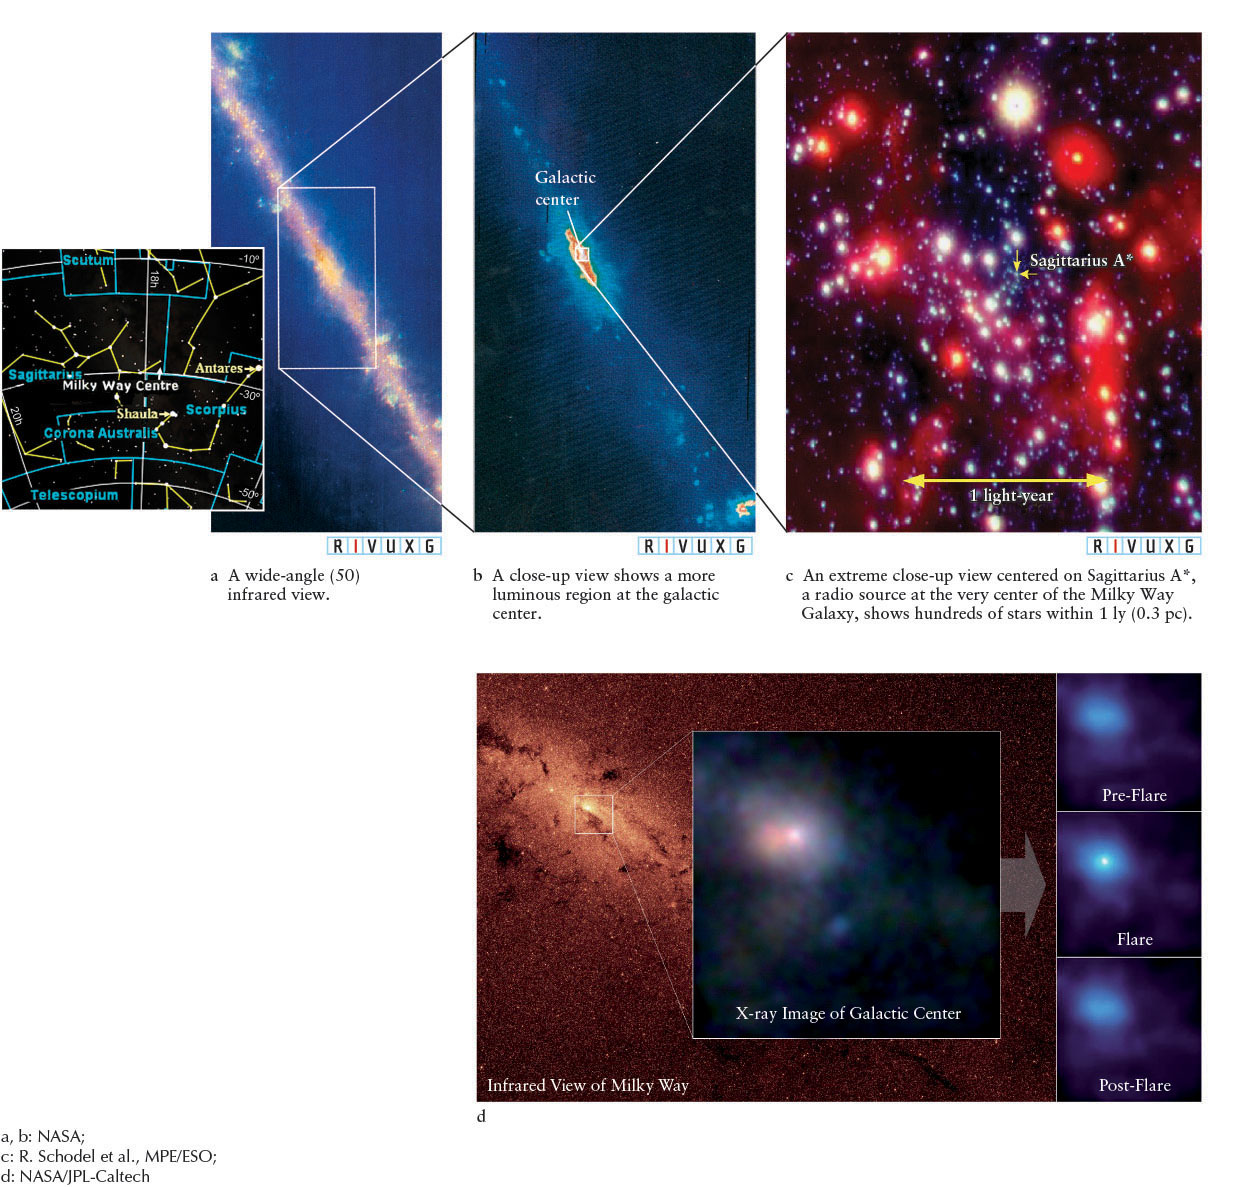
Figure 15-13 shows three infrared views that look toward the nucleus of the Galaxy. Figure 15-13a is a wide-angle view covering a 50° segment of the Milky Way through Sagittarius and Scorpius. The prominent band across this image is a thin layer of dust in the plane of the Galaxy. The numerous knots and blobs along the dust layer are interstellar clouds heated by young O and B stars. Figure 15-13b is an IRAS (Infrared Astronomical Satellite) view of the galactic center. Numerous streamers of dust (blue) surround it. The strongest infrared emission (white) comes from Sagittarius A (often abbreviated Sgr A), which is also a grouping of several powerful sources of radio waves. One of these sources, called Sagittarius A* (pronounced “A-star”), is believed to be the galactic nucleus. Figure 15-13c shows stars within 1 ly of Sagittarius A*, with resolution of 0.02 ly.
472
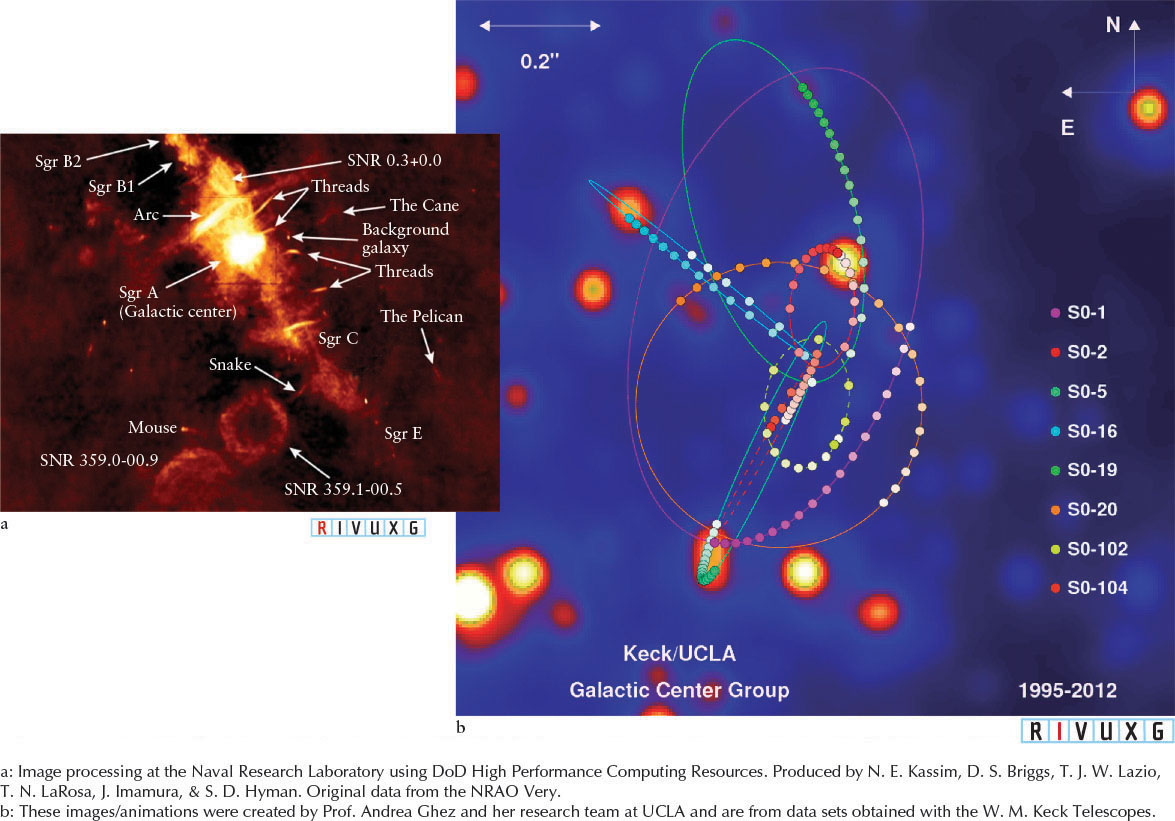
Radio observations add more to the picture of the galactic center. Some of the most detailed radio images of it come from the Very Large Array (VLA). Figure 15-14a is a wide-angle view of Sagittarius A and surrounding features, including arcs of gas, at least three supernovae remnants, and localized radio sources. Huge filaments, such as the one labeled “Arc,” lie perpendicular to the plane of the Galaxy and stretch 200 ly northward of the galactic disk, then abruptly arch southward toward Sagittarius A. The orderly arrangement of these filaments suggests that a magnetic field is controlling the distribution and flow of ionized gas, just as magnetic fields on the Sun funnel such gas to create solar prominences. This resulting radio emission, produced by high-speed electrons that spiral around these magnetic fields, is called synchrotron radiation. Despite its small size, Sagittarius A is one of the brightest sources of synchrotron radiation in the entire sky.
X-ray observations taken by the Chandra telescope in 2004 reveal that the galactic nucleus is also bathed in ultrahot gas with a temperature of 100 million K. There is growing evidence that this gas is more than a single outburst, as flares of X-rays from gas heated to this temperature have been seen erupting from Sagittarius A* in 2001 and 2012 (Figure 15-13d). This is consistent with the fact that such hot gas needs frequent reheating as it radiates away its energy (and therefore cools).
473
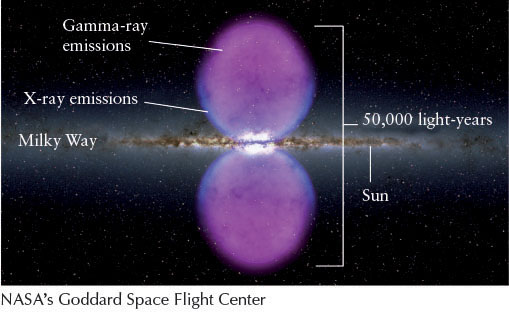
In 2010, gamma-ray emissions in the shape of a pair of enormous bubbles were also observed centered on the galactic nucleus (Figure 15-15). They may have been created by energy emitted during a recent burst of star formation observed in that region by SOFIA (the Stratospheric Observatory for Infrared Astronomy).
If the center of our Galaxy is not active and bizarre enough, recent gamma-ray observations reveal positrons either falling toward or emerging from that region at a rate of at least 1043 per second. (Recall that positrons have positive electric charges but are otherwise identical to electrons.) The source of these positrons is still unknown. Positrons can be detected because when a positron and an electron collide, they annihilate each other. Their mass is converted into energy as gamma rays with well-defined wavelengths. These special gamma rays have been observed emanating from the galactic center.
Infrared observations also reveal stars and gas in very rapid orbits around Sagittarius A* (Figure 15-14b). Something extremely massive must be holding this high-speed matter in such tight orbits around the galactic nucleus. Using Kepler’s third law, astronomers calculate that 4.3 × 10⁶ M⊙ is needed to prevent the stars and gas from flying off into interstellar space.
The 2001 flare from Sagittarius A*, mentioned above and observed by the Chandra X-ray Observatory, rose in intensity in just a few minutes. It lasted for about 3 hours, and then subsided, again in just a few minutes. The bigger, that central object is, the longer the change in brightness of the flare of X-rays will take. This is analogous to the flickering of light discussed in Guided Discovery: Identifying Stellar-Remnant Black Holes in Chapter 14. The duration of that flare indicated that the object at the center of our Galaxy is no wider than 1 AU across. The only known object that compact and with such a high mass is a supermassive black hole. Observations indicate that it is spinning very slowly, if at all, so it is likely to be a Schwarzschild black hole.
Margin Question 15-3
Question
The presence of supernova remnants at the center of our Galaxy implies what other activity is occurring in that region?
As we saw in Chapter 14, extraordinary activity is also occurring in the nuclei of most other galaxies, implying the presence of supermassive black holes at their centers as well. Astronomers are actively studying these regions in an effort to understand the complex, intriguing events that are happening in them.
15-5 Our Galaxy’s disk is surrounded by a two-shell spherical halo of stars and other matter
As mentioned at the beginning of this chapter, stars have been observed in a spherical distribution, called the halo, which consists of two concentric shells centered on the galactic nucleus and extending far beyond the disk (see Figure 15-11). The inner halo was originally discovered because of the globular clusters that it contains. Looking out of the plane of the Milky Way’s disk and between globular clusters, we see apparently unobstructed views of distant galaxies, such as the Whirlpool Galaxy observed by Lord Rosse (see Section 15-1). Most of the globular clusters orbit within about 100,000 ly of the nucleus, about twice the distance to the edge of the visible disk in which we reside.
Appearances can be deceiving. Although the brightness of the globular clusters suggests that they contain most of the stars in the halo, it turns out that about 99% of the halo’s stars are isolated halo field stars spread all through the halo. The localized concentrations of stars in globular clusters account for only 1% of the halo’s stars. It is worth noting, however, that some globular clusters are observed to contain intermediate-mass black holes, which contribute significantly to their total mass.
The globular clusters and field stars in the inner halo orbit in the same general sense that the stars in the disk orbit. The stars in the outer shell of the halo, discovered in 2007, have very little metal, implying that they are among the oldest stars in the universe. Furthermore, these latter stars orbit in the opposite sense to the motion of the disk and inner halo stars. These big differences between the two components of the halo strongly suggest that they formed from different components of the early universe. Understanding this formation process will help astronomers develop a theory of how the Milky Way developed.
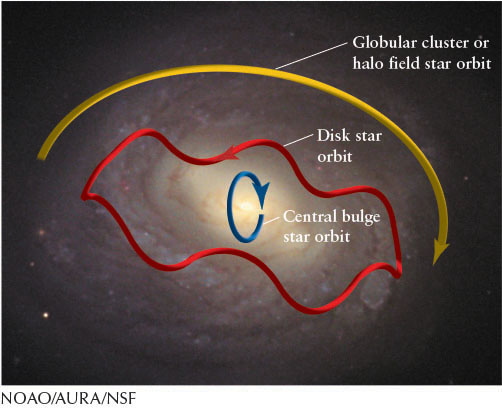
The various components of the Milky Way Galaxy, including the two shells of the halo, overlap and inter-sect each other. For example, the disk slices through the central bulge, and globular clusters and halo field stars periodically pass through the plane of the disk. Figure 15-16 shows the shapes of the orbits of typical central bulge, disk, and halo stars and clusters. Our solar system is presently moving at an angle of 25° from the plane of the Galaxy’s disk, as illustrated by the red path in the figure. We will move above the plane about 230 ly and then return, crossing the plane every 33 million years.
474
Since 1994, astronomers have observed 24 small galaxies that orbit in our Galaxy’s halo. The Sagittarius Dwarf and the Canis Major Dwarf (Figure 15-17) are named after the constellations in which their central regions lie. They have both spread widely through the halo and periodically pass through the disk of the Milky Way. These two galaxies are much smaller in size and mass than the Milky Way and are losing stars due to the disrupting influence of our Galaxy’s strong gravitational attraction. Within the next 100 million years, they will cease to exist, their stars becoming part of the Milky Way. This process of a bigger galaxy consuming a smaller one is called galactic cannibalism. The most recently discovered dwarf, called the Ursa Major Dwarf spheroidal galaxy, was found in 2005. While the consumption of these smaller galaxies is believed to have begun several billion years ago, astronomers discovered in 2011 the remnants of a galaxy, called the Aquarius Star Stream, whose consumption began only 700 million years ago. Computer simulations of galactic cannibalism performed in 2010 suggest that most of the halo field stars orbiting in the Milky Way are remnants of smaller galaxies.
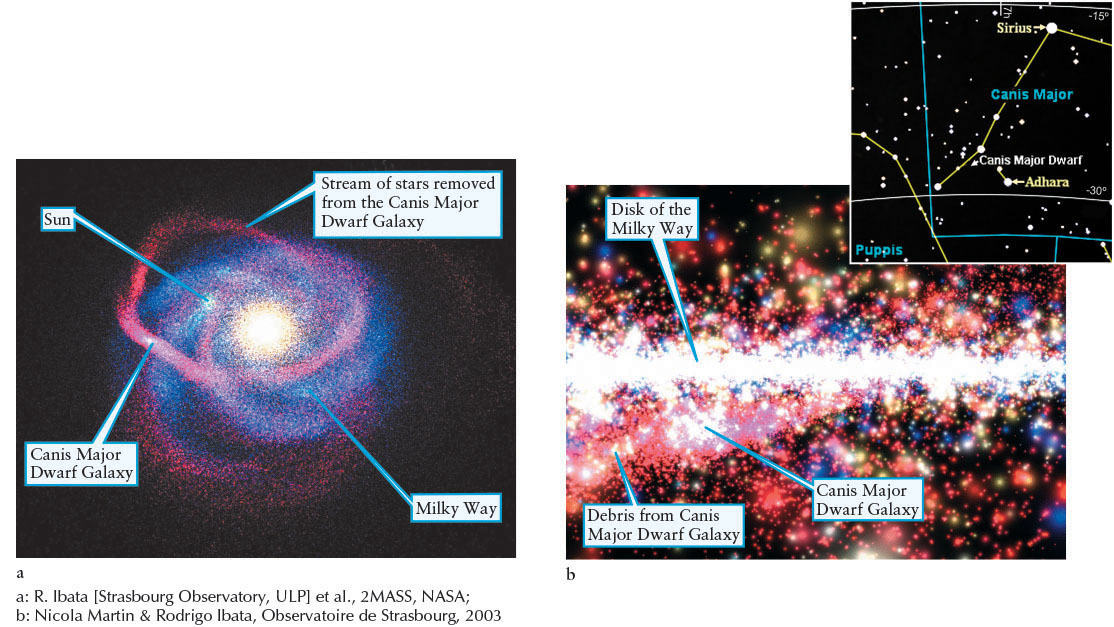
 The Nearest Galaxy (a) The Canis Major Dwarf Galaxy is a dwarf elliptical galaxy that lies some 25,000 ly from the Milky Way. This infrared radiation–based image shows the Milky Way’s spiral arms, as well as the distribution of stars being stripped from the Canis Major Dwarf Galaxy by our Galaxy’s gravitational tidal force. Containing only about 1 billion stars, the Canis Major Dwarf Galaxy will be completely pulled apart within the next 100 million years or so by the Milky Way. (b) View from Earth of the Canis Major Dwarf Galaxy and its path of debris.
15-6 The Galaxy is rotating
 Our solar system is moving at 878,000 km/h (500,000 mi/h) around the center of our Galaxy. Just as the orbital motion of the planets keeps them from falling into the Sun, the motion of the stars and interstellar clouds around the galactic center keeps these bodies apart. If the stars and clouds in our Galaxy were not in orbit, their mutual gravitational forces would have caused them to fall together and form one massive black hole billions of years ago. (Indeed, such infall of gas clouds early in the life of the universe is believed to be the origin of the supermassive black holes located at the centers of the Milky Way and other galaxies.) Just as detecting the positions of the stars and clouds has been difficult, so too has been measuring their orbital motions.
475
Observations show that the Sun’s distance from the center of the Galaxy varies little throughout its orbit. About 80% of the stars in our neighborhood have similar-shaped orbits. The other 20% have orbits that are either taking them outward from the center or inward toward it, including at least 24 stars moving outward with enough speed to leave the Galaxy forever. The fastest of these exiting, so-called hypervelocity stars is moving outward with a speed of 3.2 million km/h (2.0 million mi/h).
Radio observations of 21-cm radiation from hydrogen gas provide important clues about our Galaxy’s overall rotation. By measuring Doppler shifts, astronomers can determine the speed of objects toward or away from us across the Galaxy. These observations clearly indicate that our Galaxy does not rotate like a rigid body (Figure 15-18a), but rather exhibits differential rotation, meaning that stars at different distances from the galactic center orbit the Galaxy at different rates (Figure 15-18b).
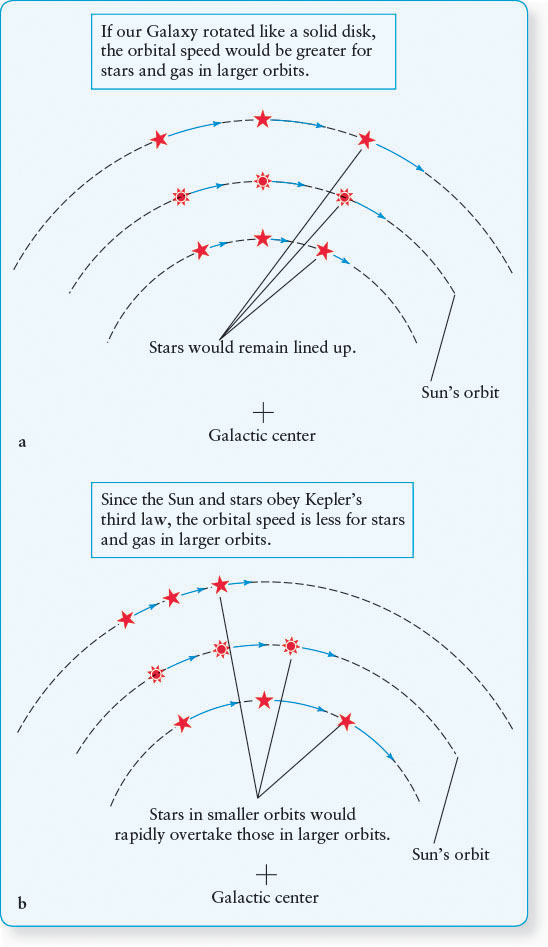
To understand differential rotation, we focus on those stars with nearly circular orbits. Because of the stars’ differential rotation in the Galaxy, the Sun is like a car on a circular freeway with the fast lane on one side and the slow lane on the other. As sketched in Figure 15-18b, stars in the fast lane (closer to the center of the Galaxy) are passing the Sun and thus appear from our vantage point to be moving in one direction, while stars in the slow lane (farther from the center of the Galaxy than our solar system) are being overtaken by the Sun and therefore appear to be moving in the opposite direction. This is like the retrograde motion of the planets discussed in Section 2-2.
Unfortunately, like the 21-cm observations, studying the motion of nearby stars and gas reveals only how fast they are moving relative to the Sun. To get a complete picture of the Galaxy’s rotation, we must find out how fast the Sun itself is orbiting the center of the Galaxy. The Swedish astronomer Bertil Lindblad (1895–1965) proposed a method of computing this speed. He noted that globular clusters do not move in the orderly pattern shown in Figure 15-18. Different globular clusters in the halo of our Galaxy orbit in different planes, and so they do not participate in the organized rotation of the objects in the Galaxy’s disk. However, the combined velocities of the globular clusters around the center of the Galaxy must average to zero or else they would drift, en masse, relative to the rest of the Galaxy. Comparing the solar system’s motion to the combined velocities of all the globular clusters, astronomers calculated the speed of the Sun’s orbit around the galactic center given earlier.
Knowing the Sun’s speed and its distance from the galactic center, astronomers can calculate the Sun’s orbital period. Traveling at 878,000 km/h, our Sun takes about 230 million years to complete one trip around the Galaxy. When the solar system last passed our present location in the Milky Way, early dinosaurs of the Triassic period roamed Earth.
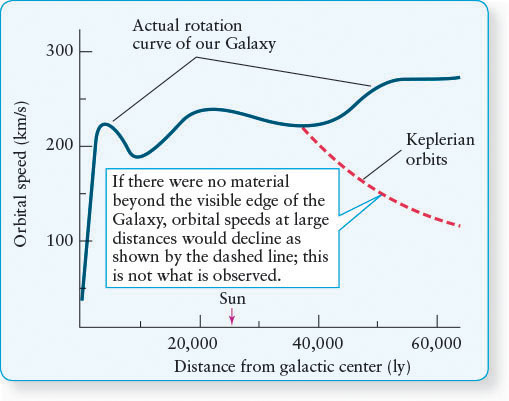
By combining the true speed of the Sun with the relative speed of the stars around us, as measured by radio astronomers, we can also determine the actual orbital speeds of the stars. This computation gives us the rotation curve of the Galaxy, a graph that shows the orbital speeds of stars and interstellar clouds at various distances from the center of the Milky Way (Figure 15-19).
476
Margin Question 15-4
Question
The complete trip of the solar system around the Galaxy is analogous to what period in Earth’s motion in the solar system?
Knowing the Sun’s velocity around the Galaxy from the rotation curve, we can use Kepler’s third law to estimate that the mass of the Galaxy that lies between us and the galactic nucleus is about 110 billion M⊙.