
Chapter 4. Chapter 4: Environmental Economics and Consumption
What is the concept of an ecological footprint...
Guiding Question 4.2
What is the concept of an ecological footprint, and how does it relate to our use of natural interest and natural capital?
Why You Should Care
Just as your footprint on the ground can give your height (there is a relationship between foot size and height), your ecological footprint gives a measure of how many acres of an ecosystem give their services to support your lifestyle.
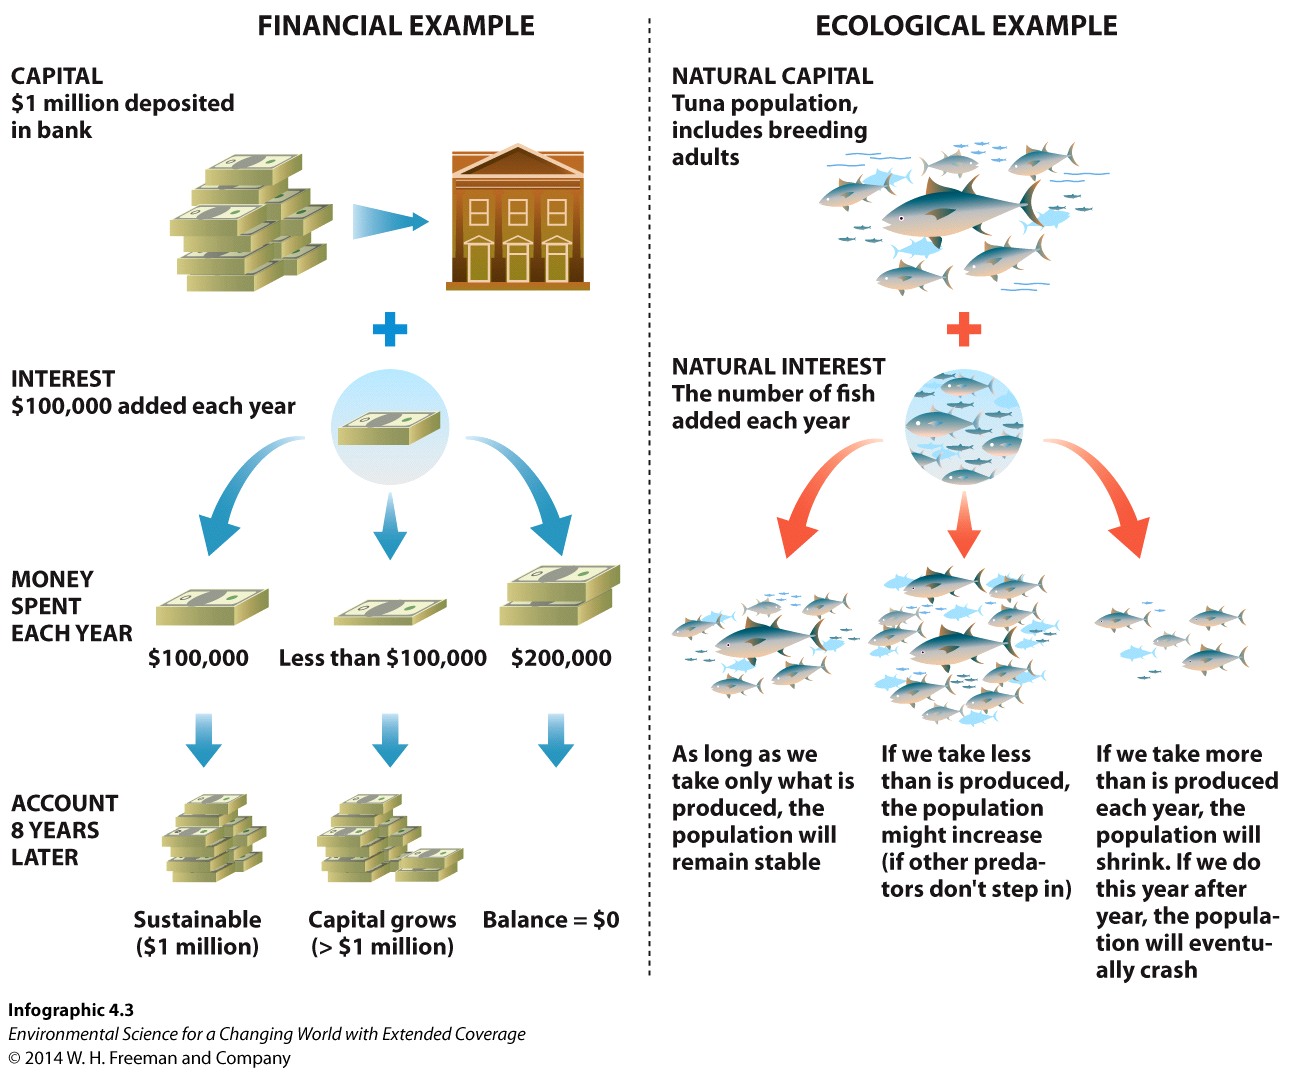
The products of the ecosystem each year (oxygen, calories, wood, etc.) are natural interest that we can harvest each year without diminishing the ecosystem’s natural capital. What happens if we take more than the natural interest? Is sustainability simply living on just the natural interest?
Obviously, each person makes different lifestyle choices, but by looking at footprints for large groups of people, we can make general conclusions about how sustainable our choices are. Sustainability then means that we can make personal choices that use only what the ecosystem can give without diminishing it (living off the natural interest and keeping the natural capital intact from year to year).
Test Your Vocabulary
Choose the correct term for each of the following definitions:
| Term | Definition |
|---|---|
| Readily produced resources that we could use and still leave enough behind to replace what we took. | |
| The wealth of resources on Earth. | |
| The land needed to provide the resources for and assimilate the waste of a person or population. |
Question Sequence
Question Sequence
Go to the Nature Conservancy webpage and calculate your carbon footprint by answering all of the questions (it should take you less than 2 minutes to complete). If the question asks you something you are unfamiliar with, click on “more info” at the end of the question to clarify. Answer as honestly as you can, but do not be concerned if you are over- or underestimating. Remember that any footprint calculation’s answer is relative.
After you complete the quiz, you will see a Results page with suggestions for lowering your footprint in several categories and an “Emissions Comparison” box on the right. Keep that page up or write down your values so that you can answer the following questions.
1.
How large is your CO2 emissions compared to the United States average? Compared to the world average?
Question Sequence
Question Sequence
Examine the graph below showing GDP (gross domestic product, a measure of how much is produced by an economy in a year) changing over time (blue line). As the blue line increases, notice that the natural interest available to wildlife decreases.
9.
When the GDP is low (around year 10), how much GDP is available to wildlife?
| A. |
| B. |
| C. |
| D. |
Activity results are being submitted...