
Chapter 5. Chapter 5: Human Populations
What cultural and demographic factors influence population growth...
Guiding Question 5.2
What cultural and demographic factors influence population growth in a given country? How do they differ between developed and developing nations?
Why You Should Care
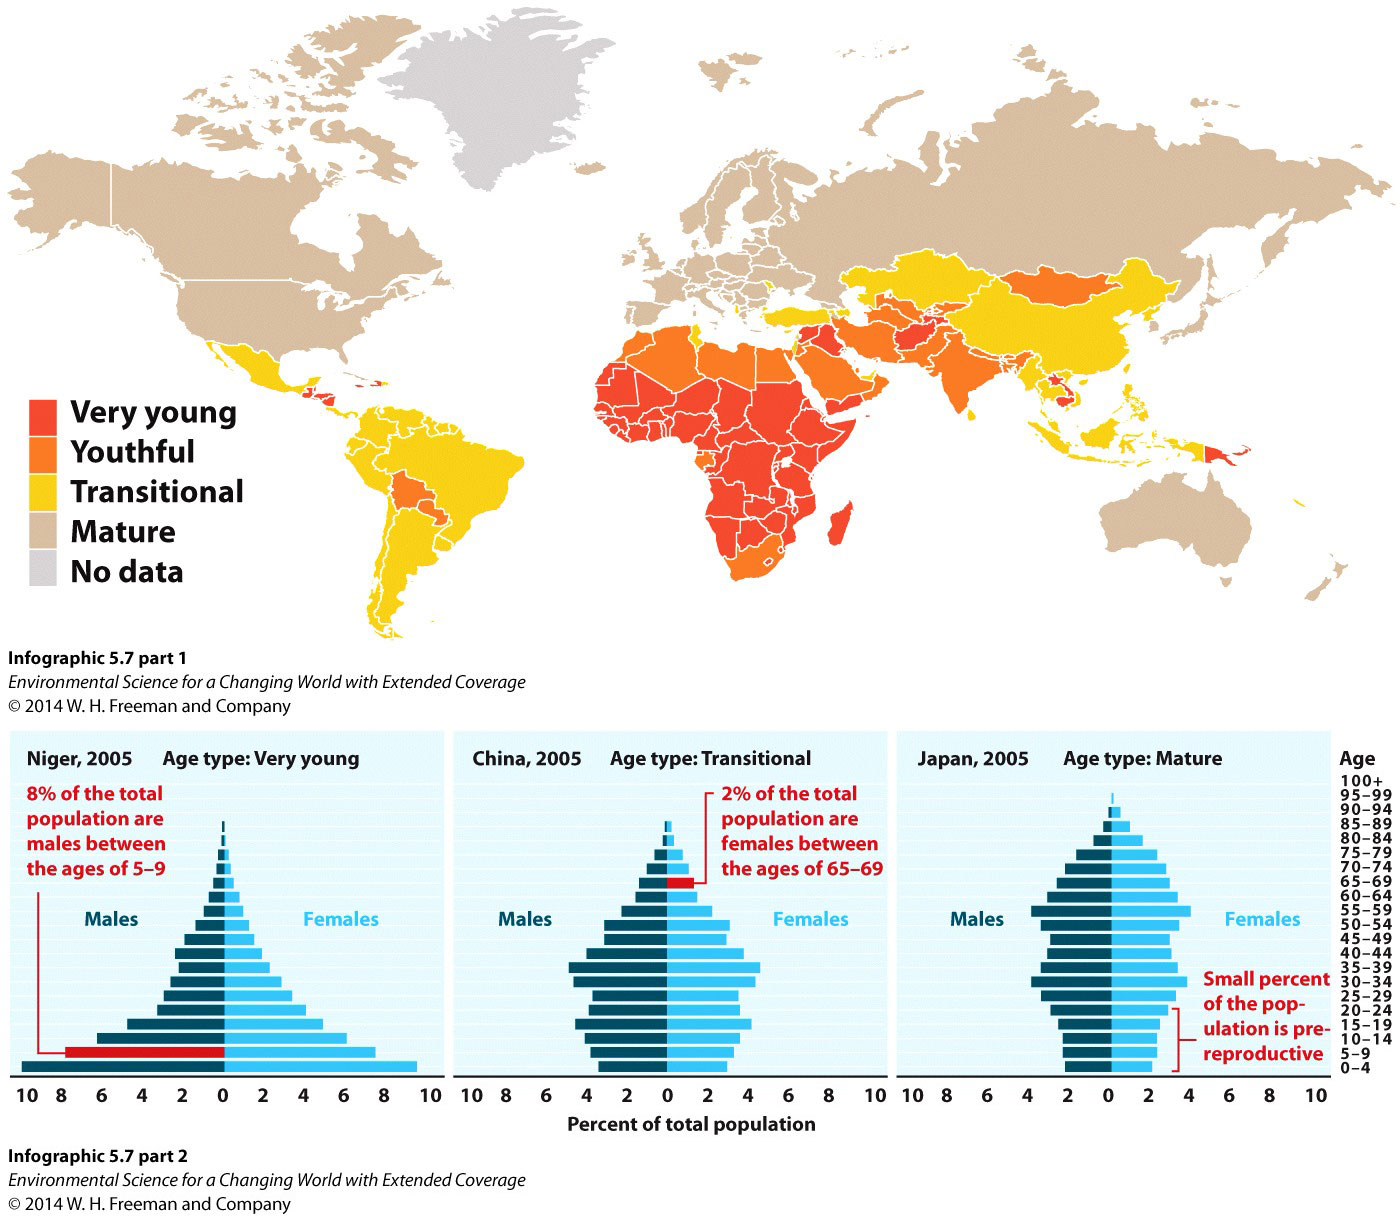
Development as it refers to nations is a process that includes shifts in the demographics of the nation, including a lowering of the total fertility rate and a shift in the age structure of the population to be more mature. The demographics of a country influence the standard of living for all. The age structure of a population relates directly to the social problems of that population: A very young population is likely to have more working-age individuals than jobs, and a mature population may have more people retired than working, which can overburden monetary and medical senior-care programs. Paying attention to the population structure in one’s own country will provide a forecast for issues that may be decades away.
Test Your Vocabulary
Choose the correct term for each of the following definitions:
| Term | Definition |
|---|---|
| A country that has a lower standard of living than a developed country and has a weak economy; may have high poverty. | |
| The number of years a person is expected to live. | |
| The number of infants who die in their first year of life per every thousand live births in that year. | |
| The number of offspring per 1,000 individuals per year. | |
| The part of a population pyramid that shows what percentage of the population is distributed into various age groups of males and females. | |
| A graphic that displays the size of various age groups, with males shown on one side of the graphic and females on the other. | |
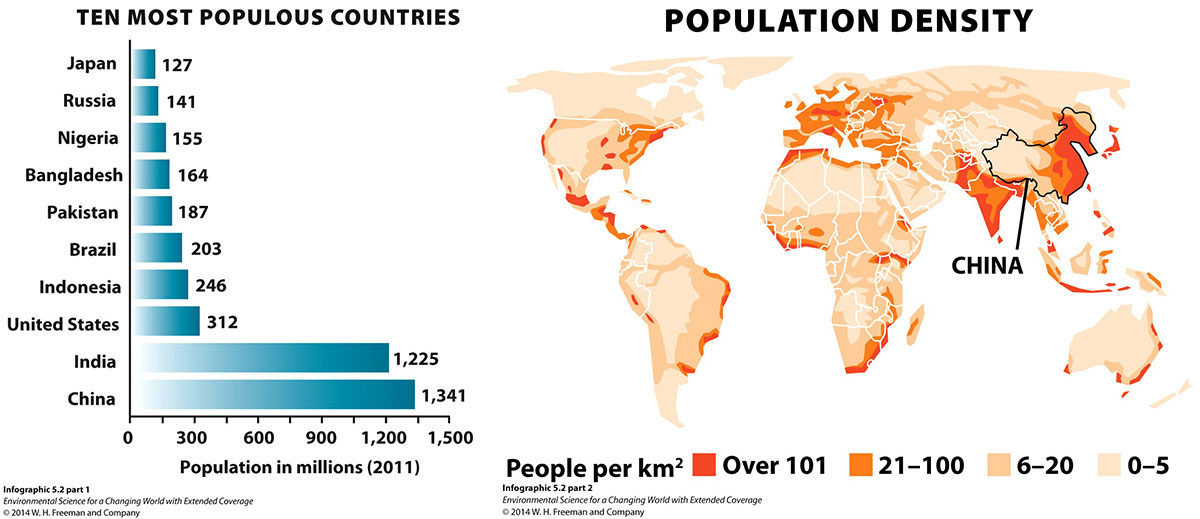
| The number of people per unit area. | |
| A country that has a moderate to high standard of living on average and an established market-economy. | |
| The percent increase of population size over time; affected by births, deaths, and the number of people moving into or out of a regional population. | |
| The number of deaths per 1,000 individuals per year. | |
| Population characteristics such as birth rate or life expectancy that influence how a population changes in size and composition. | |
| The number of children the average woman has in her lifetime. | |
| The relative number of males to females in a population; calculated by dividing the number of males by the number of females. | |
| The tendency of a young population to continue to grow even after birth rates drop to "replacement rates"--2 children per couple. |
Let’s do the math: There are a lot of different numbers involved in talking about population growth, but what do they all mean? Doing some calculations with the numbers will really help you learn the terms.
Percent Growth Rate
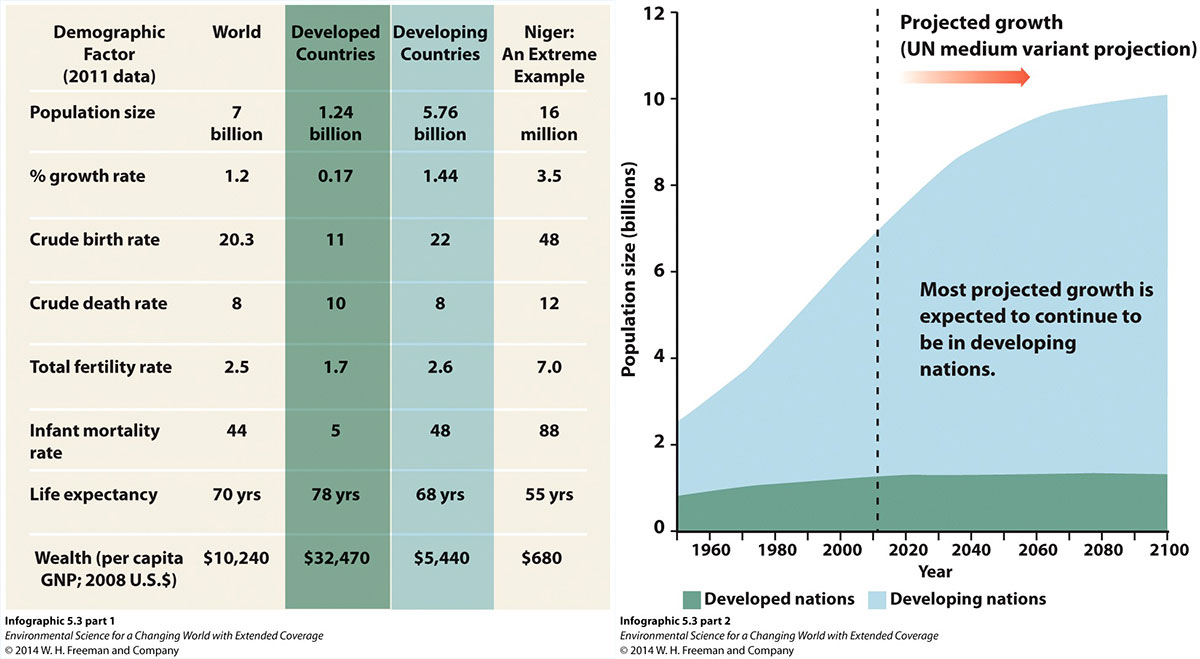
Percent growth rate of populations is the percent of the starting population that is added to it over the course of a certain period of time. That period is usually a year, as it is in the table from Infographic 5.3. So, by knowing the percent growth rate, you can determine how many people will be added each year to a given population.
EXAMPLE: The world annual percent growth rate is currently 1.2%. That doesn’t sound like much, does it? But the current world population is 7 billion people, so how many people are being added to the world population each year?
7 billion = 7,000,000,000 1.2% = 1.2/100 = 0.012 7,000,000,000 × 0.012 = 84,000,000
In other words, if we start with 7 billion people, the world’s population will increase by 84 million people in one year. That’s like adding the entire population of Germany or Vietnam to the planet each year! Clearly 1.2% is bigger than it first seems.
Question Sequence
1.
Now let’s compare developed and developing countries. Using the same method we used in the example, fill in the following table:
| Population Size | % Growth Rate | Number of People Added in One Year | |
|---|---|---|---|
| Developed Countries | 1.24 billion | 0.17% | |
| Developing Countries | 5.76 billion | 1.44% | |
| Niger: an extreme example of a developing country | 16 million | 3.5% |
Crude Birth Rate and Crude Death Rate
Both crude birth rate and crude death rate are typically listed in terms of number of individuals per 1,000 individuals per year. Expressing these rates per thousand instead of per hundred (percent) makes it easier to express them as whole numbers, and the rates per thousand are between 10 and 50 for most countries. So what does that mean?
EXAMPLE: The worldwide crude birth rate is 20.3 births per 1,000 people per year. If you want to find out how many births total that means, you can find out first how many thousands there are in the world population:
7 billion = 7 million thousands of people
Multiply 7 million thousands by 20.3 births per thousand per year, and you get 142.1 million births per year.
EXAMPLE: The worldwide crude death rate is 8 deaths per 1,000 people per year. This works out to 7 million thousands × 8 deaths per thousand, or 56 million deaths.
Make a Connection: 142 million births per year minus 56 million deaths per year is 86 million people added per year, which corresponds to the 84 million we calculated as the percent population growth rate multiplied by the world population.
Question Sequence
4.
Compare developed and developing countries: Using the statistics from Infographic 5.3, calculate how many births and deaths per year there are in developed and developing countries and check your answers by filling in the following table:
| Births per year | Deaths per year | |
|---|---|---|
| Developed Countries | ||
| Developing Countries | ||
| Niger: an extreme example of a developing country |
Total Fertility Rate
The total fertility rate is the number of children a woman is likely to have in her lifetime. So, worldwide, the average woman is likely to have 2.6 children. You can’t have 0.6 of a child, so let’s say 2 to 3—more likely 3—children in her lifetime.
6.
Compare total fertility rate to crude birth rate and percent population growth rate within each category. Do you see any patterns among these factors?
Infant Mortality Rate
The infant mortality rate is the number of children who die in their first year of life per 1,000 live births in that year. This is different from crude birth rates and crude death rates, which are the number of live births or deaths per 1,000 people. Let’s see how this works:
7.
Worldwide, the crude birth rate is 20.3, the crude death rate is 8, and the infant mortality rate is 44. How is this possible? There can’t be more infants dying each year than being born, and there can’t be more infants dying than the total number of people dying, right?
If you refer back to crude birth rate, we determined that currently there are 142.1 million live births each year because the crude birth rate was 20.3 births per 1,000 people for 7 billion people. Infant mortality is the number of infants who die per 1,000 live births. So, first we see how many thousands there are in 142.1 million: 142.1 million ÷ 1,000 = 0.1421 million, or 142,100 thousand.
142,100 thousand × 44 infant deaths per thousand = 6,252,400 infant deaths.
Recall from our discussion of crude death rates that there are 56 million deaths per year, so around 6.3 million of those 56 million deaths are infants.
Life Expectancy
Question Sequence
8.
Life expectancy is the number of years an individual is expected to live. How does the life expectancy compare to the birth rate and death rates for the different categories in the table in Infographic 5.3?
Question Sequence
13.
Which continent has the most countries with a youthful or very young population structure?
Activity results are being submitted...