
Chapter 5. Chapter 5: Human Populations
What do population growth rates look like today...
Guiding Question 5.4
What do population growth rates look like today, and how can we achieve zero population growth?
Why You Should Care
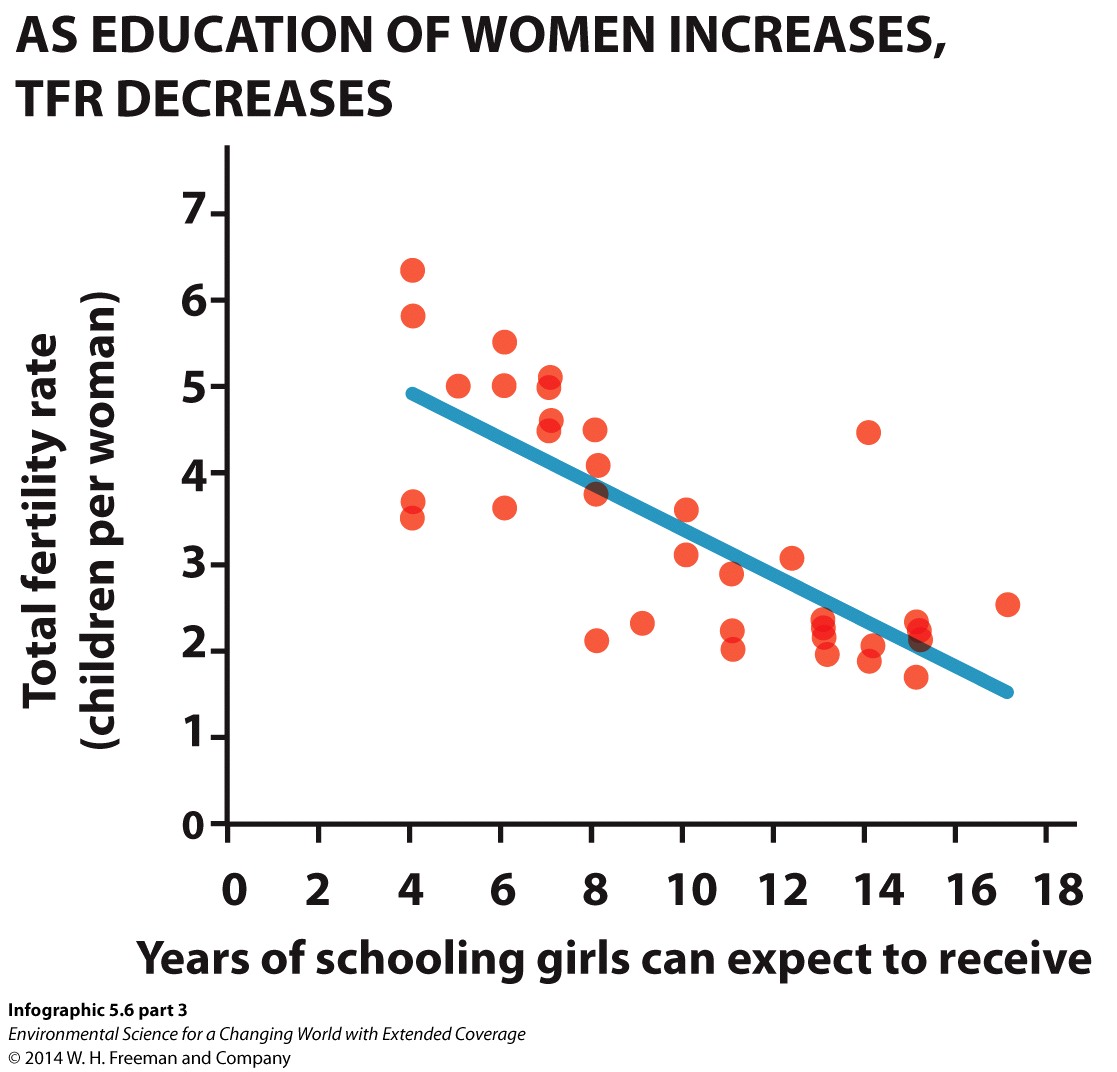
It is clear that human population growth should be a global concern, but it seems like an issue that any one individual is helpless to improve. Experience has shown that the single most effective means of reducing population growth rates in a country is to improve the education, job opportunities, and civil rights of women. The more control women have over their reproductive rights and their lives in general, the less likely they are to have large families. This is just one of many reasons that the quality of life for women in developing countries should be of paramount concern to humanitarian organizations and movements.
Question Sequence
1.
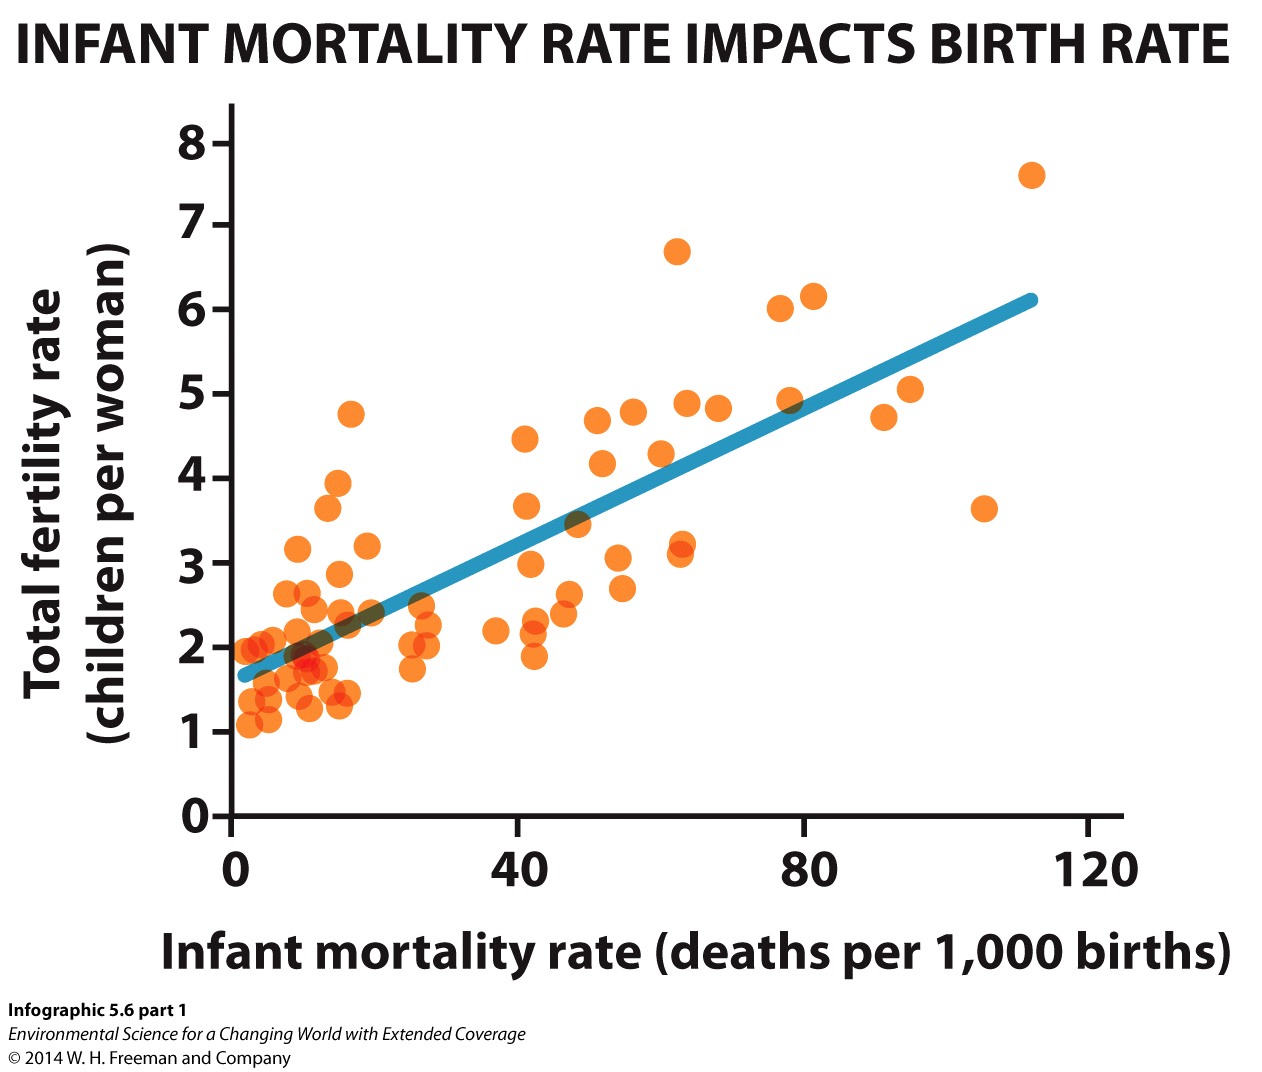
There is a trend for total fertility rates to be higher in countries with high infant mortality. In other words, in countries where infants are more likely to die, women are likely to have more children in their lifetime. Is this counterintuitive? Explain why this relationship exists.
2) High infant mortality rates are associated with lower standards of living and more poverty. Impoverished parents may decide to have a large family because they can provide help for their work and because more children means more security in the parents’ old age.
Activity results are being submitted...