What types of population growth patterns are seen...?
Interactive Study Guide
false
true
Guiding Question 8.2
What types of population growth patterns are seen, and what factors affect population growth?
Why You Should Care
We have already seen the importance of studying population growth patterns in humans, and the same holds for all species. Understanding population growth and the factors affecting population size can help experts predict when populations or entire species might be at risk for extinction or when populations of "pest" organisms, such as white-tailed deer, are going to expand.
Test Your Vocabulary
Choose the correct term for each of the following definitions:
Term
Definition
Factors, such as predation or disease, whose impact on the population increase as population size goes up.
The number of deaths per 1,000 individuals per year.
The kind of growth in which population size increases rapidly at first but then slows down as the population becomes larger; produces an S curve when plotted over time.
The population size that a particular environment can support indefinitely without long-term damage to the environment.
The change in population size over time (births minus deaths over a specific time period).
Factors, such as a storm or an avalanche, whose impact on the population are not related to population size.
Population size becomes progressively larger each breeding cycle; produces a J curve when plotted over time.
The number of births per 1,000 individuals per year.
The maximum rate at which the population can grow due to births if each member of the population survives and reproduces.
999
Try again.
Correct.
Incorrect.
1.
The biotic potential of a population:
A.
B.
C.
D.
000
Try again.
Correct.
Incorrect.
2.
What would the population be after 5 breeding cycles if the population starts with one couple and the biotic potential is 3?
Relative to mice, elephants have a ________ biotic potential.
A.
B.
C.
D.
999
Try again.
Correct.
Incorrect.
4.
When a population is close to meeting its biological potential, its size tends to grow:
A.
B.
C.
D.
999
Try again.
Correct.
Incorrect.
In the example of exponential growth in deer-mouse populations, the population starts with a single pair of deer mice and increases every breeding cycle: 2 to 10 to 50 to 250 to 1,250 to 6,250 by the fifth breeding cycle.
5.
Thought question: Describe how you would calculate the increases in population size after each breeding cycle. Do you perform the same math operation each time?
To come up with these population numbers, each population is multiplied by 5: 2 × 5 = 10 10 × 5 = 50 50 × 5 = 250 ...and so on.
6.
What would the population be after 5 breeding cycles if the population starts with one couple and the biotic potential is 3?
Thought question: What effect does lowering the biotic potential from 5 to 3 do to the shape of the population growth curve?
The growth curve is still exponential and J-shaped, but it takes longer for the base of the J to start to curve upward.
Watch the animation below and complete the drag-and-drop acitivites at the end to learn about exponenetial and logistic population growth.
8.
The population size at which the logistic population curve levels out is called the:
A.
B.
C.
D.
999
Try again.
Correct.
Incorrect.
9.
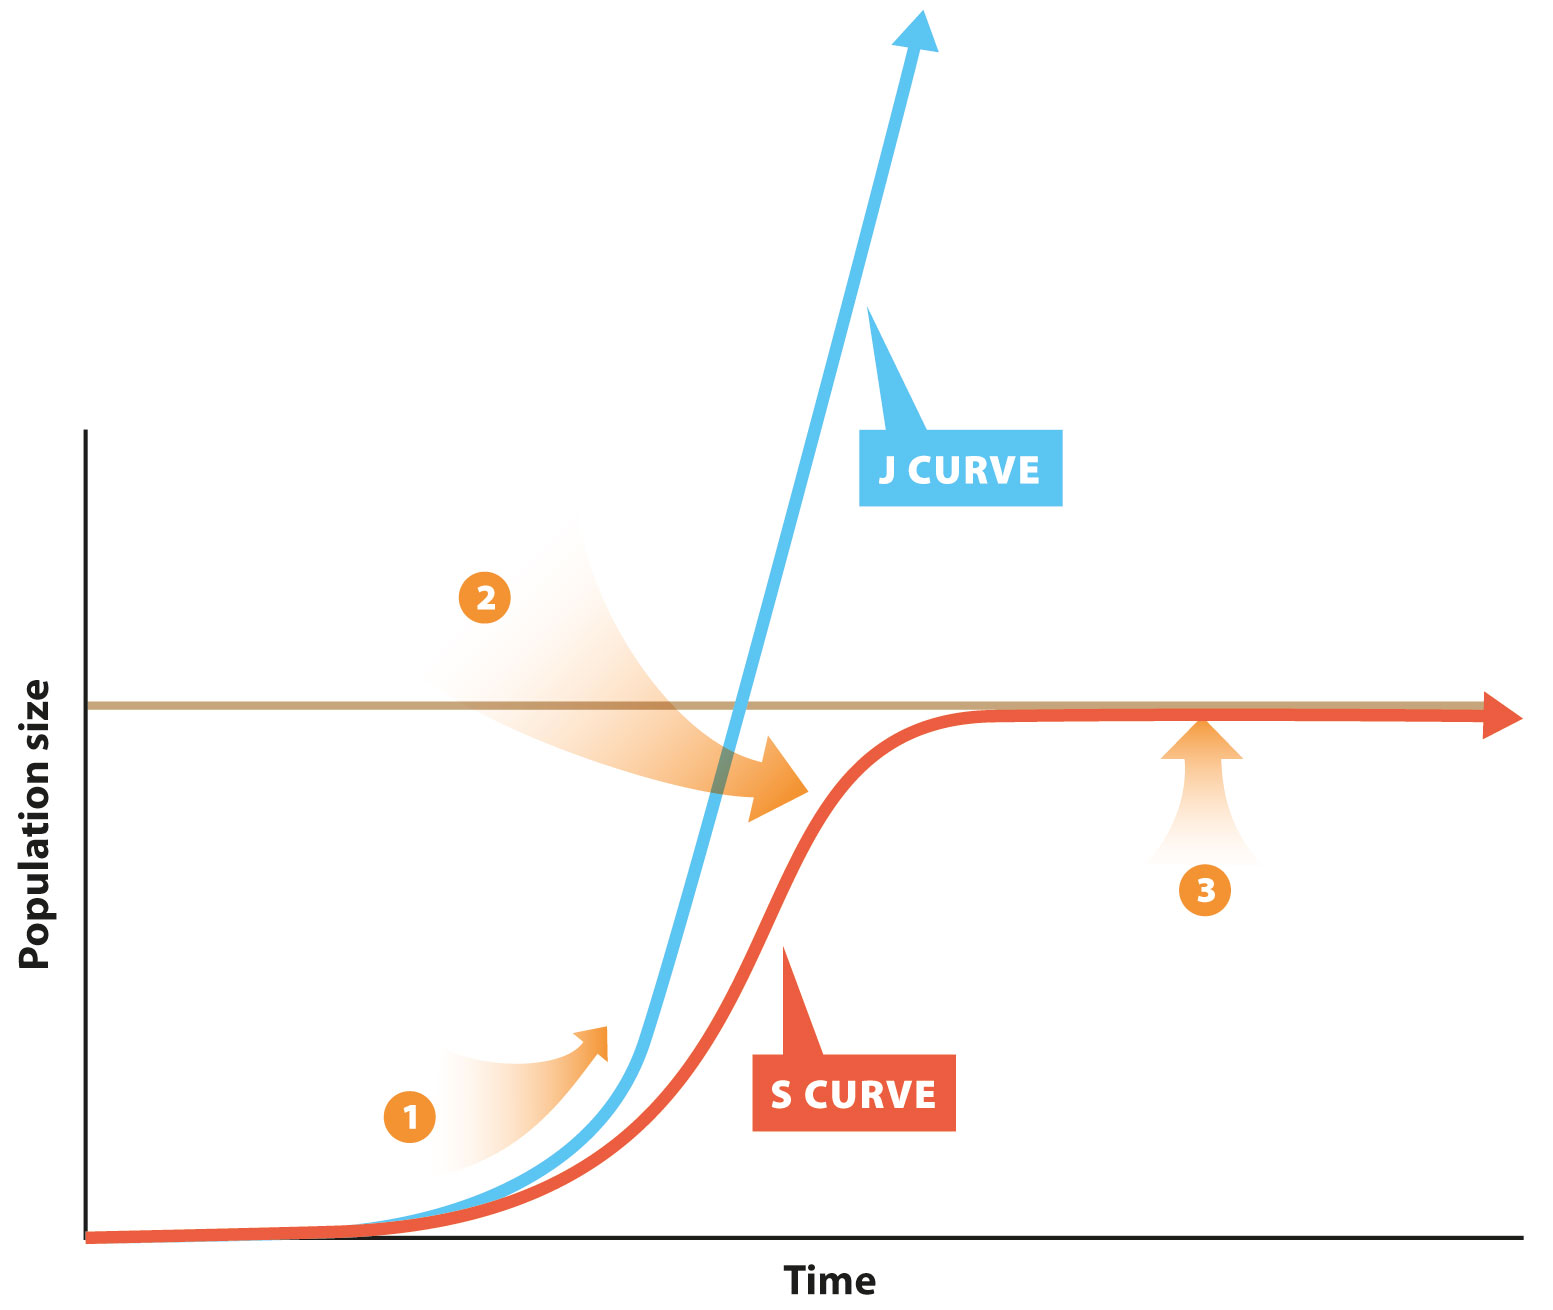
Which of the following is TRUE for region 1 in the figure?
A.
B.
C.
D.
999
Try again.
Correct. Although unending exponential growth is not actually possible, the J curve itself as a model of population growth does not level off.
Incorrect. Although unending exponential growth is not actually possible, the J curve itself as a model of population growth does not level off.
10.
Which of the following is TRUE for region 2 in the figure?
A.
B.
C.
D.
999
Try again.
Correct. The population is growing exponentially, but the growth rate is constant.
Incorrect. The population is growing exponentially, but the growth rate is constant.
11.
Which of the following is TRUE for region 3 in the figure?
A.
B.
C.
D.
999
Try again.
Correct.
Incorrect.
12.
Prey are an example of:
A.
B.
C.
D.
E.
999
Try again.
Correct.
Incorrect.
13.
Identify the following as density-dependent or density-independent factors limiting population growth and size:
Floods
Drought
Contagious diseases
Fire
Predation
999
Try again.
Correct.
Incorrect.
14.
Thought Question: The line between density-independent and density-dependent population growth limitations is often blurry. For example, the chestnut blight that killed most of the once-abundant American Chestnut trees over a century ago seems to have been an infectious disease that spread regardless of how dense the populations were. Think about the factors below and answer the questions:
A) Extreme cold should be density independent; how could it be density dependent?
B) Is famine density dependent or density independent?
A) Dense populations could be advantageous in some situations: For example, animals can huddle together for warmth.
Dense populations could also be a liability in extreme cold if there are a finite number of places in which to seek shelter and some individuals have to remain exposed.
B) If most of a food source is removed for a species, it could be worse for dense populations because there is a higher demand for food from dense populations. However, if the loss of food was nearly total, it wouldn’t matter if the population were dense or not.