Chapter 2. Chapter 2: Science Literacy and the Process of Science
What is information literacy...
Interactive Study Guide
false
true
Guiding Question 2.4
How did scientists use the process of science to help us understand what was happening with the ozone layer, and what unknowns still exist?
Why You Should Care
By now, you’ve probably noticed that the overarching theme of this chapter is what science does and doesn’t do. While it’s important to know that science never answers a question with 100% certainty and for every question answered a new one is asked, that doesn’t mean that scientific findings can’t be used to improve our lives.
Infographic 2.7: Ozone Depletion and CFC Levels

Question Sequence
Question 2.1
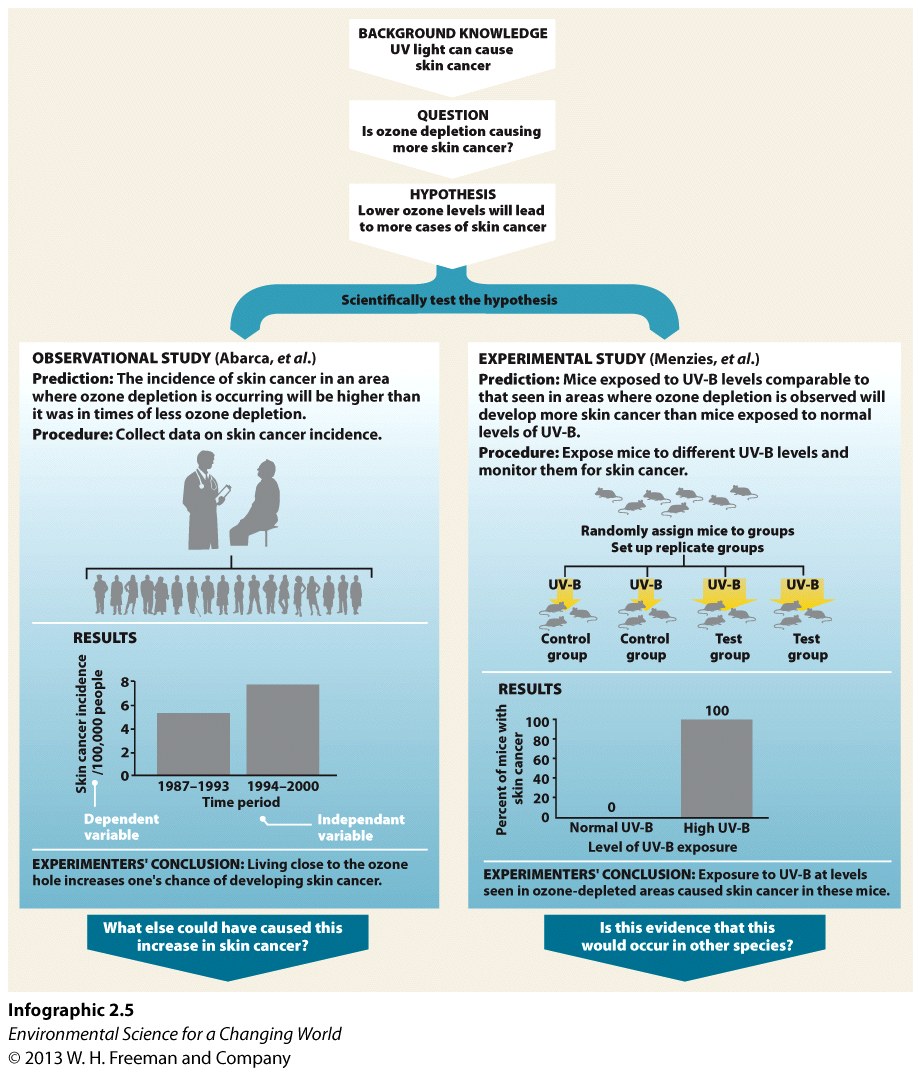
These data are only reporting what was discovered, so it is observational.
Question 2.2
They probably tried to publish their findings next. They may still have tried to publish if they had been incorrect or tried to test a second hypothesis. Make sure your hypothesis is plausible.
Question 2.3
an5d7rPO+6ix5DGUYL3BCk8zUYwk6i0LJZfObqMxt0YPKZxj47gKmQK3P0RS7LL0C2RSu067MVLWJrr6YKOTuF+GmhuVTKejLwj75t6IATzXlJvqiwoiIUCnUGmuCHrDNwdmc7yhaLy1Sp2mt1D5XPXSMKw/s1BduS1Vl15xDf3zDqSWyUTYifOSeu7qNH7csVmrBJROHXCm3uhmd65Pd0UCHHyXJjBqqhQo+L16UfH012+fh61lHp1dEpgluc+ZEMeMFgKtIT+IjmL0WDAt4WTmSwsZmcdkYSmAysRAdMUY+9O5r086gvlQ4qcdkh/2HQQS9wSDeDm8fdSqL1yUVza0Z5LMmZiONo, they are in different units; you can tell because there are two vertical axes with different unit labels on the left and right. CFCs are presented in parts per thousand (ppt). Ozone layer thickness is measured in Dobson units (DUs), a kind of measure invented specifically for studying the ozone layer. You would have to pay close attention to find this, however, since it is only written out in the key to the South Pole ozone maps.
Question 2.4
gZP5ajoPB/jrrkaCeLTvg6TNT9b8xpK/75GKhXIQnXkGpEKusElx0NYGUSmziVK3umDj/ZZRrkGshEgzPdQRmLHe7DkLXmfekkanGmSQbUhdpVegaGpfsGONZ1R84DWy3MHMobhYinokkQsGRA94yfs6XWZ0XfjlwEwMxBTpio/GYt4FC4TJldAOKgo34DI7kLrBljMqZj761ozo3KC9KN3er8Pu+uZJQ2T27EyNMhPViSAHddNMy/c6SIN29itXMFpTvwmPUBH4sq8zwrpvhw==The smooth curve is there to indicate the general trend, or average. The jagged line with many points indicates the variation from year to year.
Question 2.5
u5RDmaJ29QYalpqWBwxFkCLxvFCza64NVnorZMP6fmdqVGbOjn9vvSJVY62wKaOA1/wO3D9BcaqcDoJgLVeon4nAao3wupgpLUj/E9VJ5HFaj0QKs1P0jjITmT6kk1mE1/O9+wGbH8RDIKNWl229kiKUXmH/SGOp9pVp0cBZM0ebGC1CYQC19Q70d0VxnSCQMIU3rPG/ml2xlCtDAUoDtK+IZPa8Vl23VjT9CE5GHr5vSfYUOdRNh81ldHiv780WYou could come up with many different hypotheses, such as alterations to global wind circulation that year.
Question 2.6
Znr/LHF7k0gcUOA7jYhG819D1SgBpU1fpODMgv0nVKI3HfISsV86M/po7NUZ5utA/OpXroXwLoDDMtw+G7YXRDL2a5bc/q0rxxtDEw==The trend in the curve seems to predict that it is getting larger.