Chapter 14. Global Climate Change
Global Climate Change

Introduction:
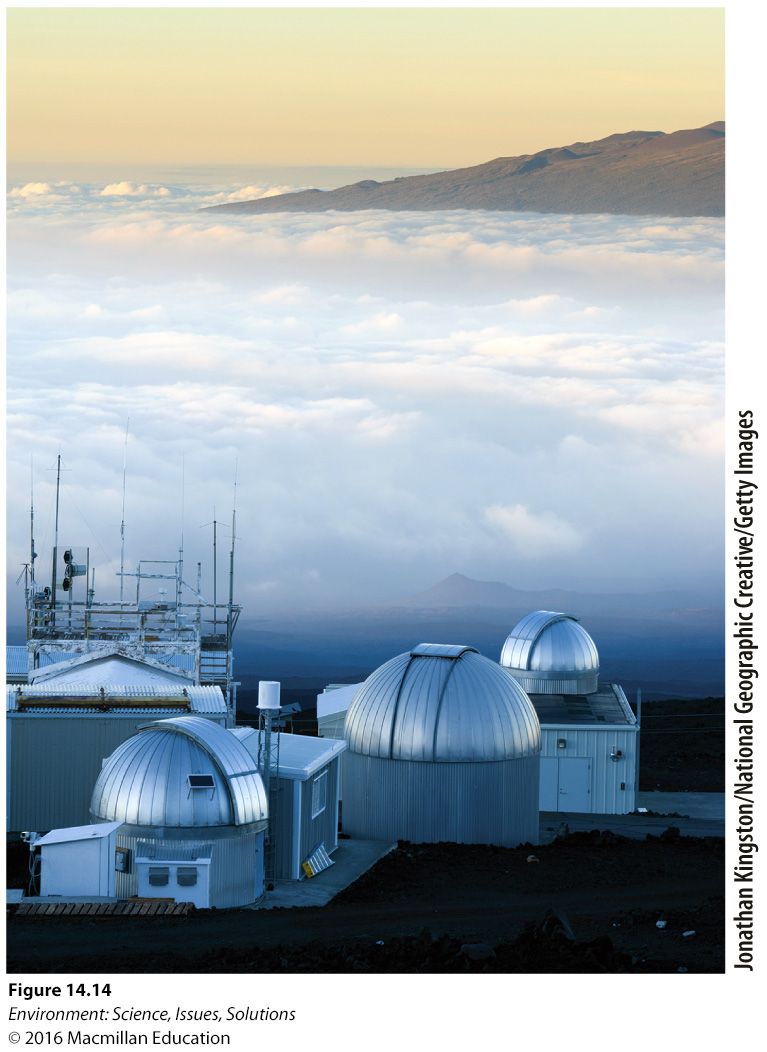
Carbon dioxide (CO2) is a greenhouse gas that has a significant impact on climate. Human activities, such as the combustion of fossil fuels and deforestation, have inadvertently put more CO2 into the atmosphere than was present before these activities became widespread. Because matter cannot be destroyed, it must be cycled out of the atmosphere and it was long thought that the oceans and vegetation would have the capacity to do so. Regular measurements of atmospheric CO2 levels have been taken at Mauna Loa, Hawaii since the end of the 1950’s, providing a substantial amount of historical data with which we can track the concentration of CO2 in the atmosphere over time.
CO2 Concentrations
Question
Carbon dioxide concentrations in the atmosphere are measured in parts per million (ppm). To see how these concentrations have been rising or falling in recent times, create a graph showing the monthly average of carbon dioxide concentration in parts per million (ppm) between January of 2012 and January of 2014. Using the drop down menus, you can select the time frame for the data set you would like to display.
1. During what month of 2013 does the CO2 concentration reach its highest point for 2013?
| A. |
| B. |
| C. |
| D. |
Question
2. The highest concentration for the year is reached in May and then declines for several months. Yet we have learned that there is strong evidence for increasing atmospheric carbon dioxide concentrations. Does this data contradict the trend?
| A. |
| B. |
| C. |
| D. |
Question
3. Between January and December of 2013, what is the percent change in carbon dioxide concentration between the highest and lowest points? (Hint: To calculate percent change, find the difference (increase or decrease) between the two numbers you are comparing. Next, divide the difference by the original number and multiply the answer by 100. The equation looks like this: ((y2-y1)/y1)*100).
| A. |
| B. |
| C. |
| D. |
Question
4. What does this percent change suggest in terms of overall atmospheric carbon dioxide concentration?
| A. |
| B. |
| C. |
| D. |
Question
Now create a graph showing the monthly average of carbon dioxide in parts per million (ppm) between January of 1970 and January of 1972.
5. During what months of 1971 was the carbon dioxide level at its lowest and highest, respectively?
| A. |
| B. |
| C. |
| D. |
Question
6. What is the percent change in carbon dioxide level between the highest and lowest points in 1971?
| A. |
| B. |
| C. |
| D. |
Question
7. How does this percent change compare with the percent change calculated in the previous section?
| A. |
| B. |
| C. |
| D. |
Question
8. Now create a graph with the entire data set from 1958 to 2015. What is the percent change between the highest carbon dioxide level in 1959 and the highest concentration recorded in 2015? (Hint: It may be helpful to zoom in to the individual years to determine which value is highest. You can do this by manipulating the time frame parameters on the graph controls)
| A. |
| B. |
| C. |
| D. |
Question
9. Why does the lowest concentration of CO2 in each year occur at the same time of year?
| A. |
| B. |
| C. |
| D. |
Question
10. In 1997, nations began ratifying the Kyoto Protocol with the objective of reducing greenhouse gas emissions below 1990 levels. Compare the highest concentration measured in 1990 with that measured in 2015. What can we conclude from this data?
| A. |
| B. |
| C. |
| D. |