Impaired waters are those that have recurring water quality issues – in other words, they are chronically in violation of the Clean Water Act.
As this map shows, a significant portion of the water bodies in the United States fall within this definition.
Part B: Examine the Data Set
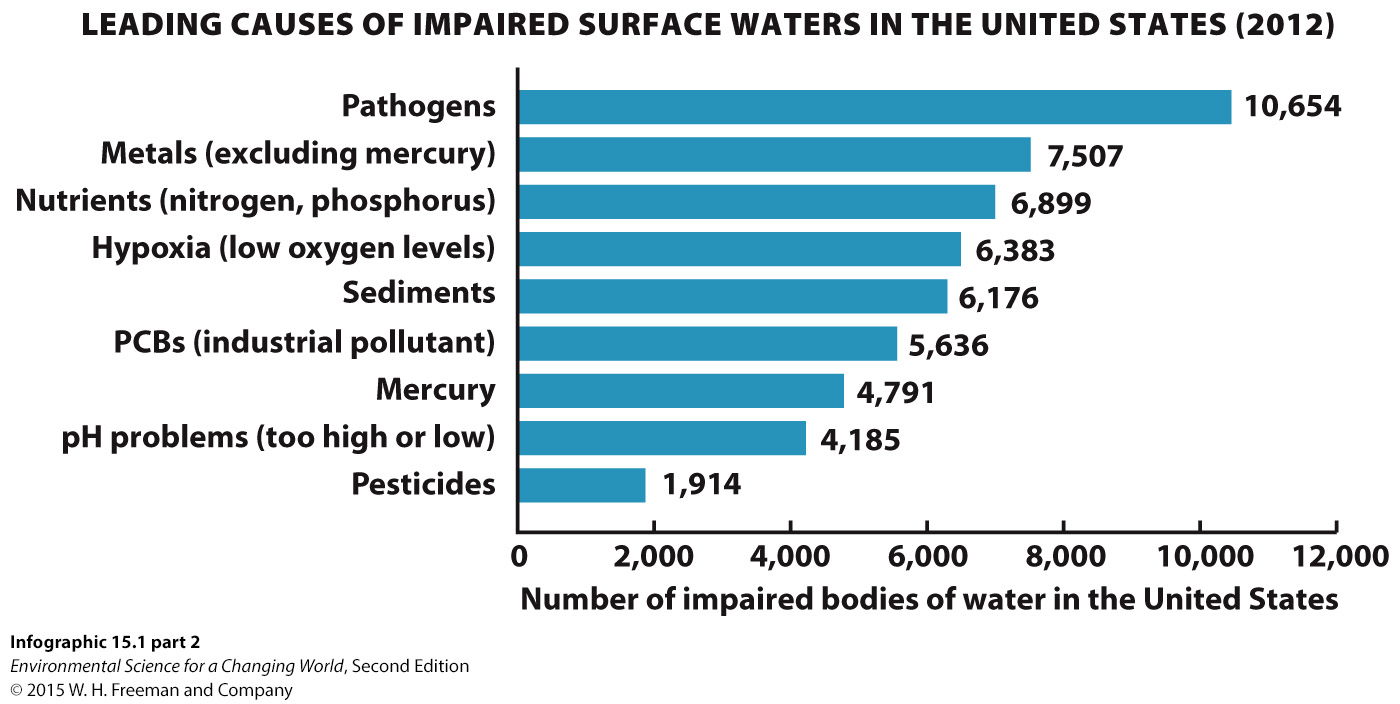
The EPA has identified the leading causes of impaired surface waters in the United States as:
Cause of Impaired Water
Number of Impaired Bodies of Water
Pathogens
10,457
Metals (excluding mercury)
7,462
Nutrients (Nitrogen, Phosphorus)
6,998
Hypoxia
6,498
PCBs (industrial pollutant)
6,352
Sediments
6,255
Mercury
3,930
pH (too high or too low)
3,744
Pesticides
1,874
Part B: Examine the Data Set
Cause of Impaired Water
Number of Impaired Bodies of Water
Pathogens
10,457
Metals (excluding mercury)
7,462
Nutrients (Nitrogen, Phosphorus)
6,998
Hypoxia
6,498
PCBs (industrial pollutant)
6,352
Sediments
6,255
Mercury
3,930
pH (too high or too low)
3,744
Pesticides
1,874
1.
Which of these most accurately describes what we need to do with the data?
A.
B.
C.
D.
E.
Correct.
Incorrect.
2.
Which is the independent variable in this data set, and which axis would it be graphed on?
A.
B.
C.
D.
Correct.
Incorrect.
Part C: Build the Graph
Instructions: Create a graph below. Label the X axis as “Causes of Impaired Water”, and label the Y axis as “Number of Impaired Waters in the United States”. Then give the chart a relevant title and input the data below into the graph. OMIT COMMAS in the numerical values when entering them in the graph.
Cause of Impaired Water
Number of Impaired Bodies of Water
Pathogens
10,457
Metals (excluding mercury)
7,462
Nutrients (Nitrogen, Phosphorus)
6,998
Hypoxia
6,498
PCBs (industrial pollutant)
6,352
Sediments
6,255
Mercury
3,930
pH (too high or too low)
3,744
Pesticides
1,874
Table
Part C: Build the Graph
Bar graphs can be displayed in more than one way. They can be constructed vertically, like the one you just made, or horizontally like this:
In this example, the entire graph is rotated, so the X and Y axis labels are switched.
Part D: Apply Skills
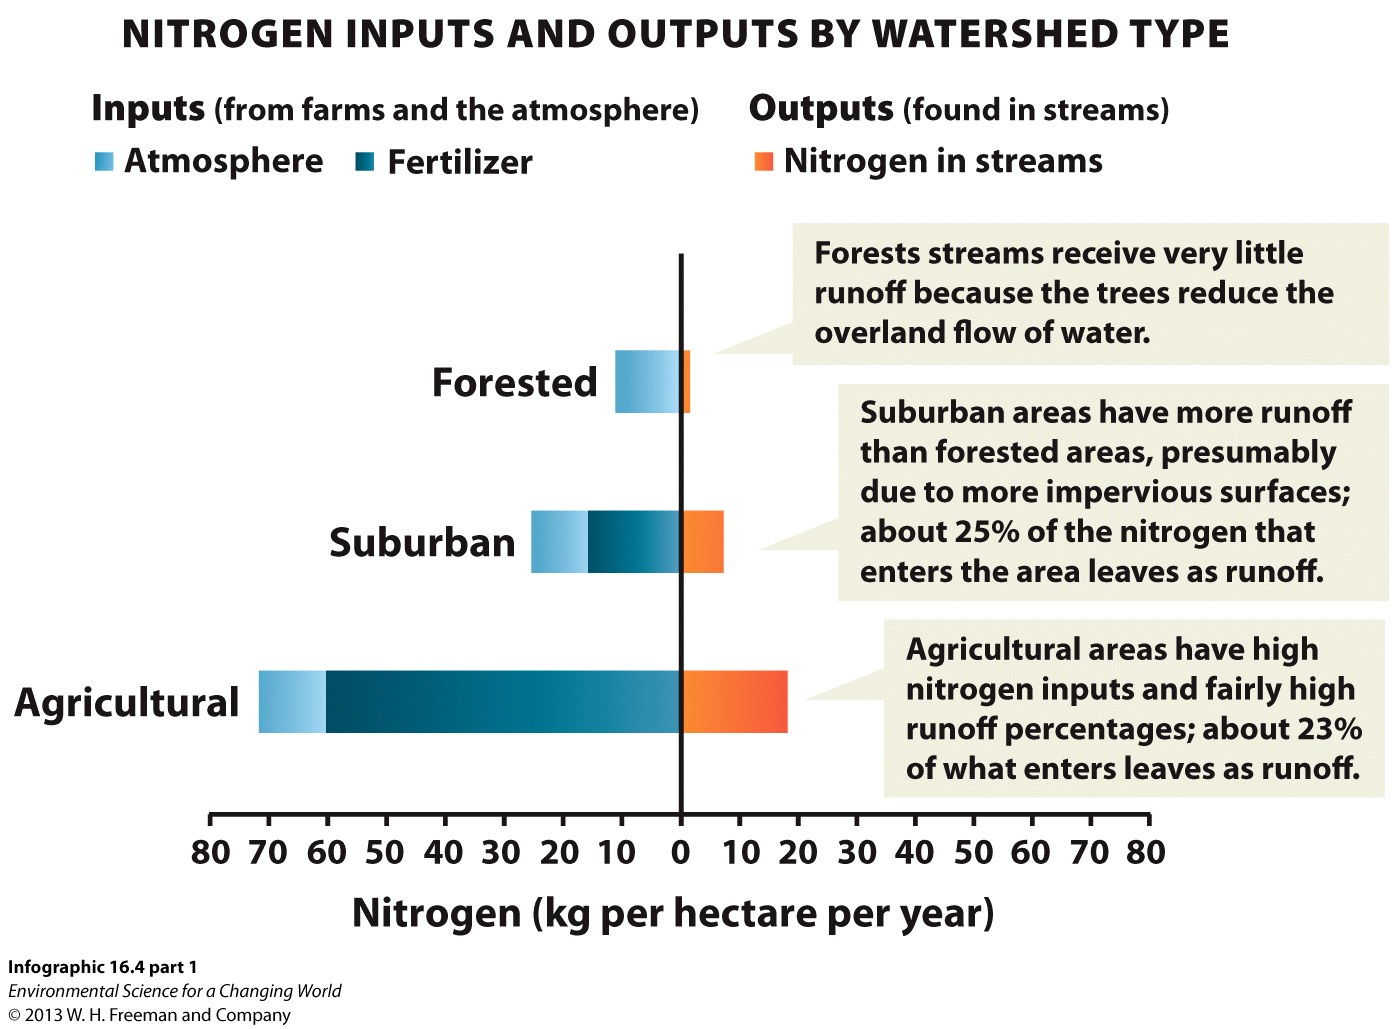
Infographic 16.4 shows the relative amounts of nitrogen from the atmosphere and fertilizer that enters the soil and eventually runs off into nearby water bodies in three different types of watersheds.
3.
Which variable is the dependent variable?
A.
B.
Correct.
Incorrect.
4.
Which watershed type has the greatest amount of nitrogen input, and which source does most it come from?
A.
B.
C.
D.
E.
Correct.
Incorrect.
Part D: Apply Skills
5.
Which of these best describes the amount of nitrogen that enters the three watersheds from the atmosphere?
A.
B.
C.
D.
Correct.
Incorrect.
6.
Which of the three types of watersheds has the greatest percentage of nitrogen input that runs off?
A.
B.
C.
Correct.
Incorrect.
7.
Which of the three watershed types would you expect to have the least amount of water runoff based on the data shown?