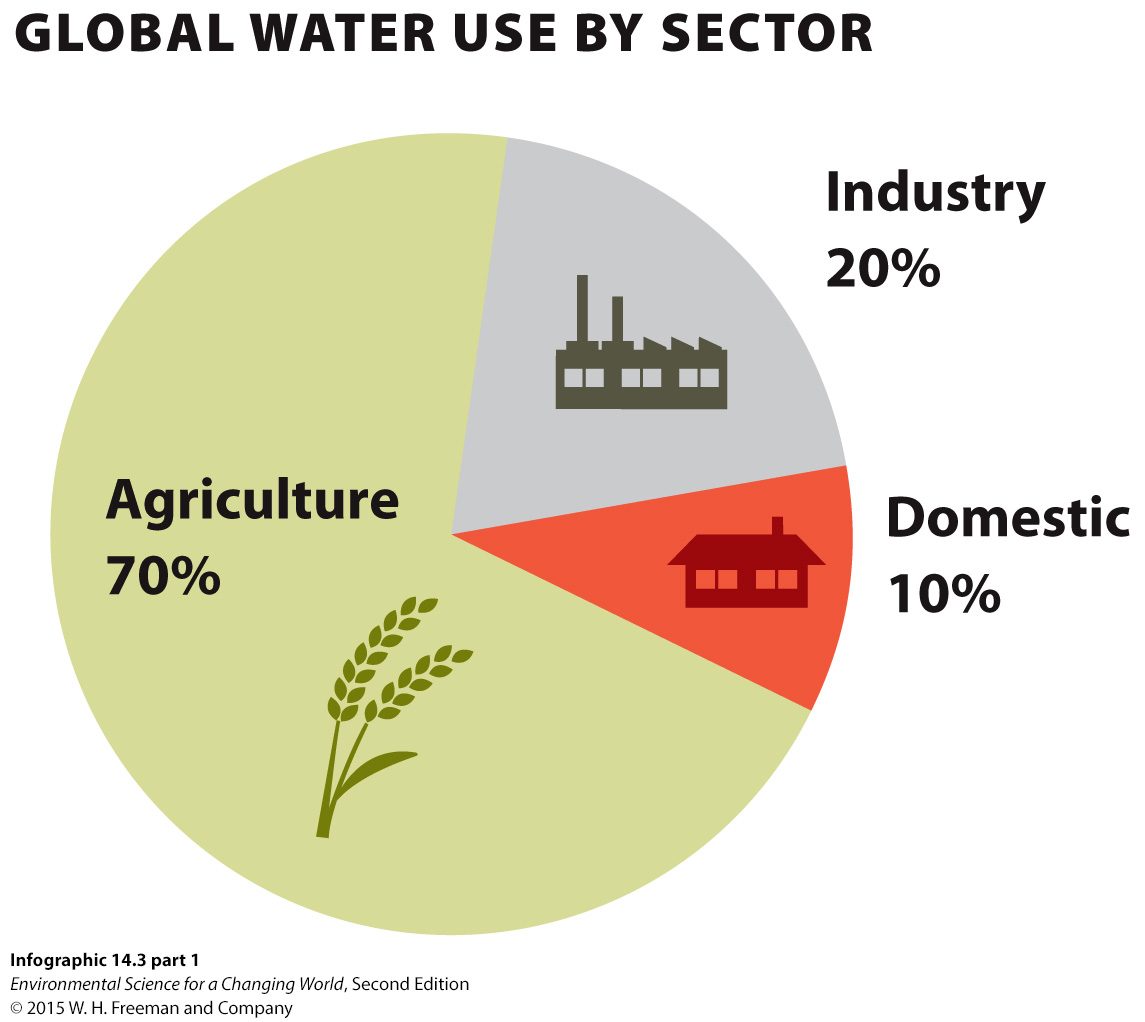
Water is an essential to all life. The majority of water extracted for human use is for agriculture, followed by industry. Domestic or household use only accounts for about 8% of all water use, but it is one that we can directly influence with our daily actions.
As humans, we rely on fresh water (water that has few dissolved ions such as salt in it).
Part B: Examine the Data Set
The distribution of water on Earth can be divided by type (saltwater, freshwater), and source.
Type of Water
Percent of Total Water on Earth
Oceans
97%
Freshwater
3%
Table
Water Source
Percent of Fresh Water
Glaciers and Ice Caps
87%
Groundwater
12%
Surface and Other Waters
1%
Table
Water Source
Percentage of Surface and Other Waters
Lakes
52%
Soil Moisture
38%
Atmosphere
8%
Rivers
1%
Water in Living Organisms
1%
Table
1.
Which of these most accurately describes what we need to do with the data?
A.
B.
C.
D.
E.
Correct.
Incorrect.
2.
Which type of graph would be most appropriate for this data?
A.
B.
C.
D.
E.
Correct.
Pie charts are useful when the groups represented by the independent variable are all discrete categories (e.g. types of water) rather than a numerical sequence (e.g.1,2,3…).
3.
Which part of the data represents the independent variable that the labels of this chart will be based on?
A.
B.
Correct.
Incorrect.
Part C: Build the Graph
Instructions: Create a graph title, such as “Distribution of Water on Earth”. Take a blank circle and input the percentages, which would then be drawn in, colored, and labeled. Create three pie charts, one for each table in this order: Total water, followed by freshwater, followed by surface and other waters.
Type of Water
Percent of Total Water on Earth
Oceans
97%
Freshwater
3%
Table
Water Source
Percent of Fresh Water
Glaciers and Ice Caps
87%
Groundwater
12%
Surface and Other Waters
1%
Table
Water Source
Percentage of Surface and Other Waters
Lakes
52%
Soil Moisture
38%
Atmosphere
8%
Rivers
1%
Water in Living Organisms
1%
Table
Part D: Apply Skills
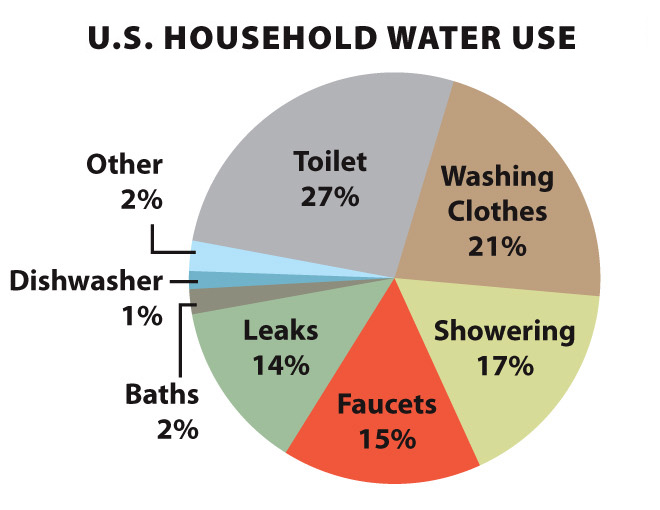
Infographic 15.4 shows the breakdown of the three major sectors that use water, and how much.
Infographic 15.7 breaks the domestic portion further into how water is used in a typical U.S. household.
4.
What is the single biggest use of water in U.S. households?
A.
B.
C.
D.
E.
Correct.
Incorrect.
5.
If the typical U.S. household uses about 50 gallons of water per day, how much of that water is used to flush the toilet?
A.
B.
C.
D.
E.
Correct.
Incorrect.
6.
If the pie chart on infographic 15.4 was changed so that toilet flushing had its own slice (instead of being included in the domestic use pie chart), about what percentage would it be?