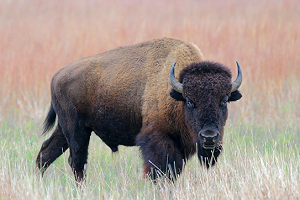
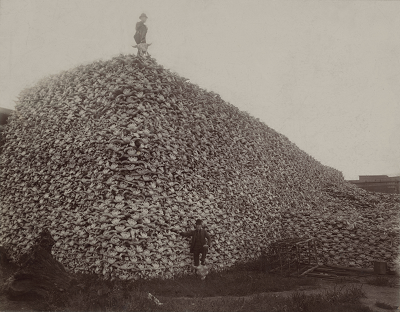
In this tutorial, we are going to examine changes in population numbers over time. Specifically, what has happened to bison numbers in the western U.S. since they were nearly extirpated in the late 1800’s? How should we manage their numbers?
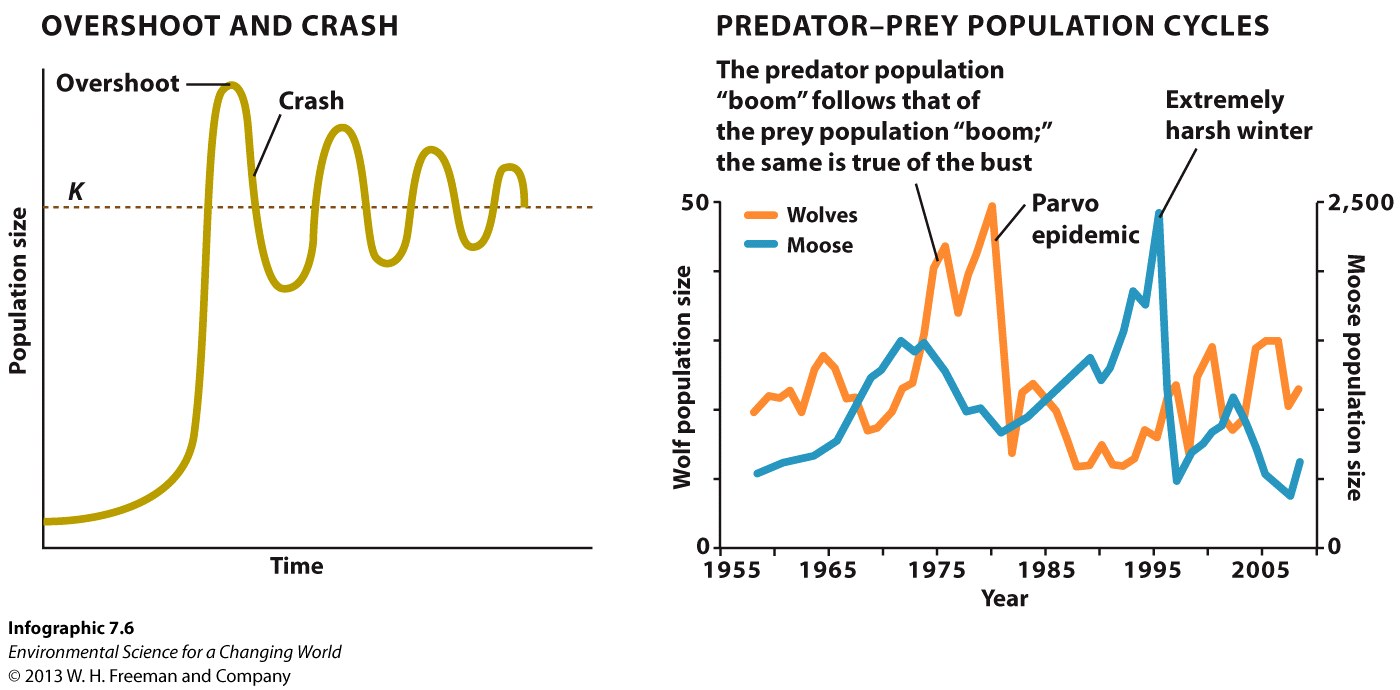
Before you graph these data, let’s take a look at infographic 7.6 in your text.
Question 1 of 5
1.
What type of graph is shown?
A.
B.
C.
D.
E.
2.
Looking at the figure on the right labeled Predator-Prey Population Cycles, what was the largest population size of wolves?
A.
B.
C.
D.
3.
The left figure is an example of a theoretical change in population size over time. What is happening to the size of the population near the origin (where the X and Y axes cross) of the graph?
A.
B.
C.
4.
Examine the right hand graph. What is the primary take home message of the graph?
A.
B.
C.
D.
5.
What do you predict happened to the moose population after 2006 based on the graph?
A.
B.
C.
D.
Correct.
Incorrect.
1.1Part B: Make a Graph
Let’s look again at similar data for bison in Yellowstone national park. We are interested in the relationship between time and the size of the herd. The issue for parks is how many bison can the land support—what is carrying capacity?
Year
Yellowstone North (Site 1)
Yellowstone Central (Site 2)
Wind Cave (Site 3)
Wichita Mountains (Site 4)
1902
21
25
1903
29
21
1904
41
17
1905
44
30
1906
57
1907
61
25
15
1908
74
22
1909
100
23
1910
123
29
1911
147
27
1912
171
49
1913
170
53
14
1914
198
1915
243
31
1916
294
72
1917
338
70
1918
390
1919
417
91
1920
457
61
60
180
1921
533
76
1922
582
69
1923
686
76
1924
766
120
1925
873
66
1926
889
65
1927
977
72
1928
1050
61
160
1929
1198
1930
1229
108
210
1931
1302
1932
1238
240
1933
1192
1934
1127
180
1935
1094
1936
749
207
230
1937
473
218
1938
579
201
160
1939
649
229
205
1940
633
238
115
380
1941
748
274
1942
713
358
160
1943
751
224
180
1944
757
397
230
1945
445
487
165
1946
548
481
177
1947
449
188
1948
550
647
195
1949
396
730
300
1950
458
864
300
580
1951
640
315
1952
386
840
360
1953
370
1954
225
1319
385
1955
420
980
1956
231
1400
410
1957
205
610
1958
375
1959
400
1960
360
780
1961
212
657
1962
1963
656
440
1964
220
1965
172
608
310
980
1966
68
228
1967
81
319
260
1000
1968
71
351
215
1969
85
474
215
1970
216
262
285
500
1971
322
394
1972
232
379
215
1973
290
494
1974
205
716
1975
182
785
650
1976
259
901
1977
457
893
1978
217
1362
415
1979
433
1307
460
1980
287
1801
485
600
1981
298
1739
1982
405
1346
360
1983
432
1447
300
1984
588
1671
1985
517
1834
330
470
1986
708
2068
1987
595
2381
1988
844
2303
360
1989
430
2077
1990
349
2672
400
570
1991
544
2568
1992
267
3090
1993
626
2703
300
1994
738
3376
1995
712
3216
330
650
1996
756
2828
1997
354
1816
1998
572
1618
260
1999
548
1688
2000
634
2144
310
590
2001
700
2500
360
650
2002
750
2750
400
650
2003
900
2680
320
650
2004
890
3100
360
650
2005
1501
3500
410
650
2006
1490
2400
470
650
2007
2000
2500
360
650
2008
1500
1500
410
650
2009
460
650
2010
Now, you are going to create a graph that appropriately represents these data. If you’re not sure which type of graph to choose, review the following tutorial on graphing skills:
Based on what you know about graphing, what type of graph is most appropriate for these data?
A.
B.
C.
D.
E.
Once you’ve selected the type of graph you’d like to create, enter your data for Yellowstone North and Yellowstone Central.
7.
Which of the columns is the X-axis?
A.
B.
C.
8.
Based on your graph, what has happened in general to bison populations in Yellowstone since the early 1900’s?
A.
B.
C.
1.2Part C: Alter the Graph
Now, add two more sites to your graph. These data are bison population sizes in Wind Cave National Park and the Wichita Mountains Wildlife Refuge.
Notice that in each bison population, there are periodic declines in the population. All of these populations are located in national or state parks; during the 20th century there were few natural predators in any of the parks. The bison herds are managed by people to remain near carrying capacity for their location.
9.
Which of the following is probably NOT a variable that could influence the carrying capacity of these parks specifically?
A.
B.
C.
D.
E.
Applet
Part D: Summary
Scatter plots are used when there is more than one y-value for the x-values. By graphing these data, you can see several things:
Bison were almost exterminated in the wild and were reintroduced at extremely small population sizes in these parks
A concern for biologists is the genetic diversity of the herds in these parks because they began with small numbers
The size of the herds would grow larger if it were not for human intervention. Many organizations contend that we should let the herds get bigger and extend beyond the boundaries of parks. Others say that because there are no natural predators, large numbers of bison could compete with cattle. Bison also share diseases with cattle that ranchers would rather avoid.