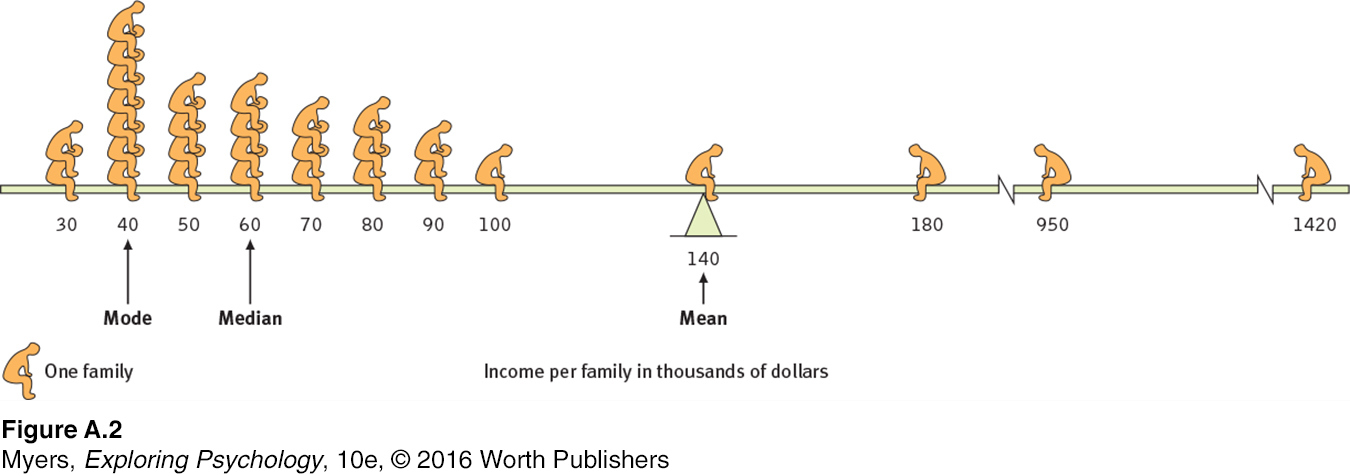
FIGURE A.2 A skewed distribution This graphic representation of the distribution of a village’s incomes illustrates the three measures of central tendency— mode, median, and mean. Note how just a few high incomes make the mean— the fulcrum point that balances the incomes above and below— deceptively high.
[Leave] [Close]