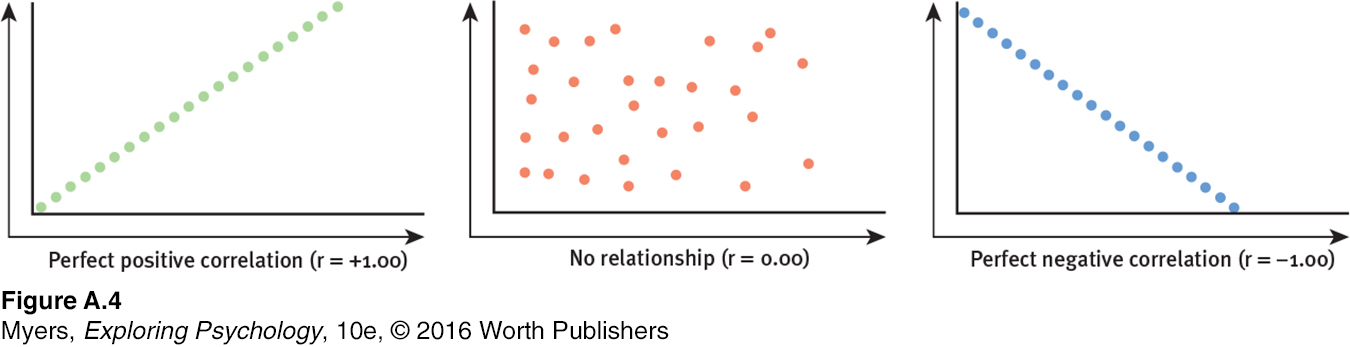
FIGURE A.4 Scatterplots, showing patterns of correlation Correlations— abbreviated r—can range from +1.00 (scores on one measure increase in direct proportion to scores on another), to 0.00 (no relationship), to –1.00 (scores on one measure decrease precisely as scores rise on the other).
[Leave] [Close]