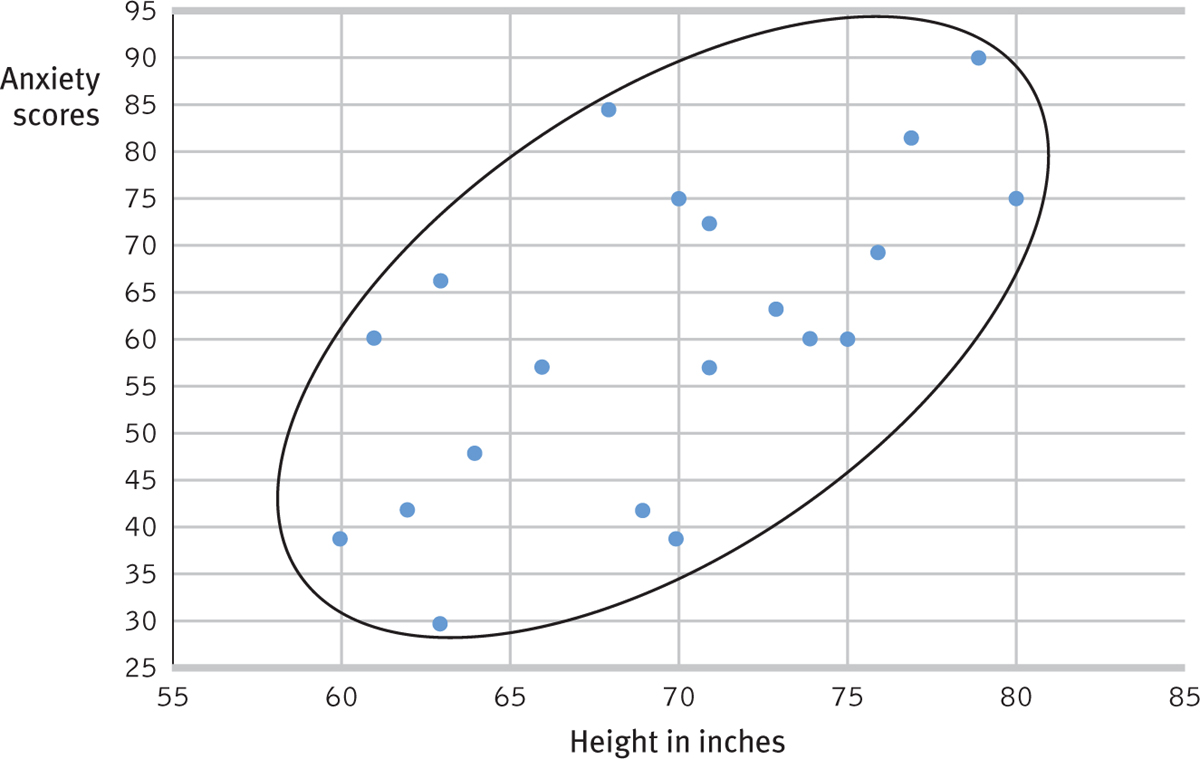
FIGURE A.5 Scatterplot for height and anxiety This display of data from 20 imagined people (each represented by a data point) reveals an upward slope, indicating a positive correlation. The considerable scatter of the data indicates the correlation is much lower than +1.00.
[Leave] [Close]