9.4 Genetic and Environmental Influences on Intelligence

354

Intelligence runs in families. But why? Are our intellectual abilities mostly inherited? Or are they molded by our environment? Few issues in psychology arouse so much passion. Let’s examine some of the evidence.

Twin and Adoption Studies

9-22 What evidence points to a genetic influence on intelligence, and what is heritability?

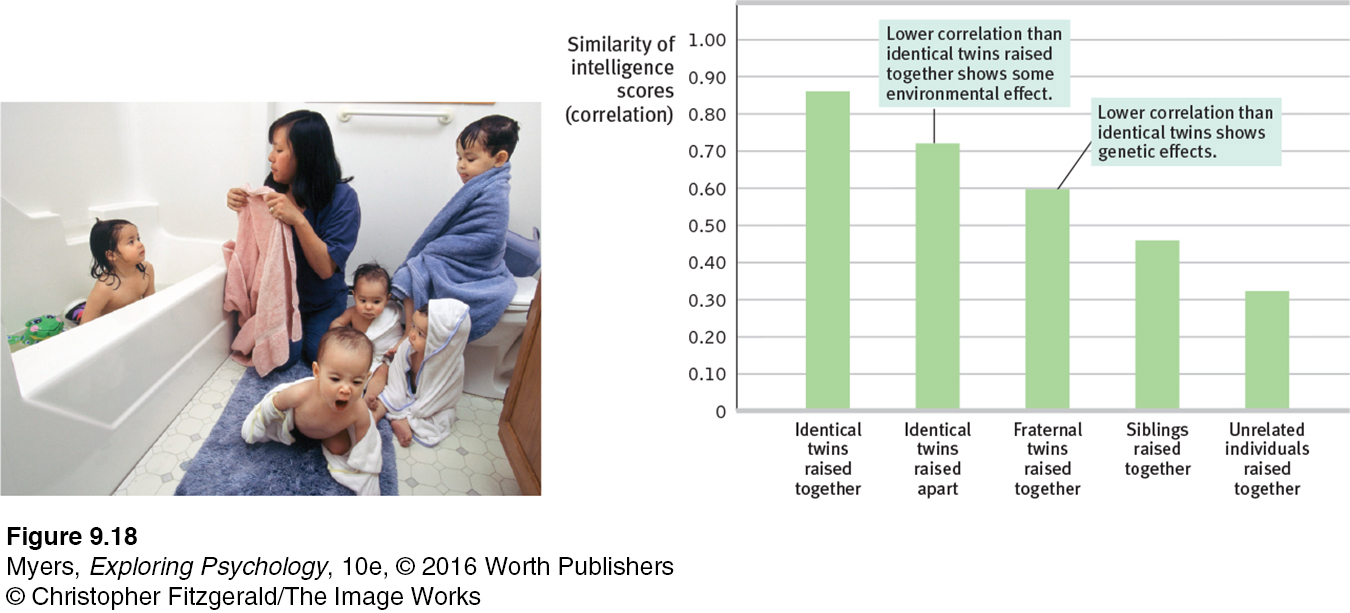
Do people who share the same genes also share mental abilities? As you can see from FIGURE 9.18, which summarizes many studies, the answer is clearly Yes.

image
Figure 9.18: FIGURE 9.18 Intelligence: Nature and nurture The most genetically similar people have the most similar intelligence scores. Remember: 1.0 indicates a perfect correlation; zero indicates no correlation at all. (Data from McGue et al., 1993.)
© Christopher Fitzgerald/The Image Works

heritability the proportion of variation among individuals that we can attribute to genes. The heritability of a trait may vary, depending on the range of populations and environments studied.

image
The New Yorker Collection, 1999, Donald Reilly from cartoonbank.com

Identical twins who grow up together have intelligence test scores nearly as similar as those of the same person taking the same test twice (Haworth et al., 2009; Lykken, 1999). (Fraternal twins, who typically share only half their genes, differ more.) Even when identical twins are adopted by two different families, their scores are very similar. Estimates of the heritability of intelligence—the extent to which intelligence test score variation can be attributed to genetic variation—range from 50 to 80 percent (Calvin et al., 2012; Johnson et al., 2009; Neisser et al., 1996). Identical twins also exhibit substantial similarity (and heritability) in specific talents, such as music, math, and sports. Heredity accounts for more than half the variation in the national math and science exam scores of British 16-year-olds (Shakeshaft et al., 2013; Vinkhuyzen et al., 2009).

image See LaunchPad’s Video: Twin Studies for a helpful tutorial animation.

Scans of identical twins’ brains reveal that gray- and white-matter volume is similar, and areas associated with verbal and spatial intelligence are virtually the same (Deary et al., 2009; Thompson et al., 2001). Their brains also show similar activity while doing mental tasks (Koten et al., 2009).

Although genes matter, there is no known “genius” gene. One worldwide team of more than 200 researchers pooled their data on the DNA and schooling of 126,559 people (Rietveld et al., 2013). No single DNA segment was more than a minuscule predictor of years of schooling. Together, all the genetic variations they examined accounted for only about 2 percent of the schooling differences. The gene sleuthing continues, but this much seems clear: Intelligence is polygenetic, involving many genes (Bouchard, 2014). Wendy Johnson (2010) likens it to height: 54 specific gene variations together have accounted for 5 percent of our individual differences in height, leaving the rest yet to be explained.

355

Where environments vary widely, as they do among children of less-educated parents, environmental differences are more predictive of intelligence scores (Rowe et al., 1999; Tucker-Drob et al., 2011; Turkheimer et al., 2003). To see why, consider humorist Mark Twain’s fantasy of raising boys in barrels until age 12, feeding them through a hole. Let’s take his joke a step further and say we’ll give all those boys an intelligence test at age 12. Since their environments were all equal, any difference in their test scores could only be due to heredity—thus, heritability would be 100 percent. But what if a mad scientist cloned 100 boys and raised them in drastically different environments (some in barrels and others in mansions)? In this case, heredity would be equal, so any test-score differences could only be due to environment. The environmental effect would be 100 percent, and heritability would be zero.

Adoption studies help us assess the influence of environment. Consider:

image
The New Yorker Collection, 2000, Leo Cullum from cartoonbank.com. All Rights Reserved.

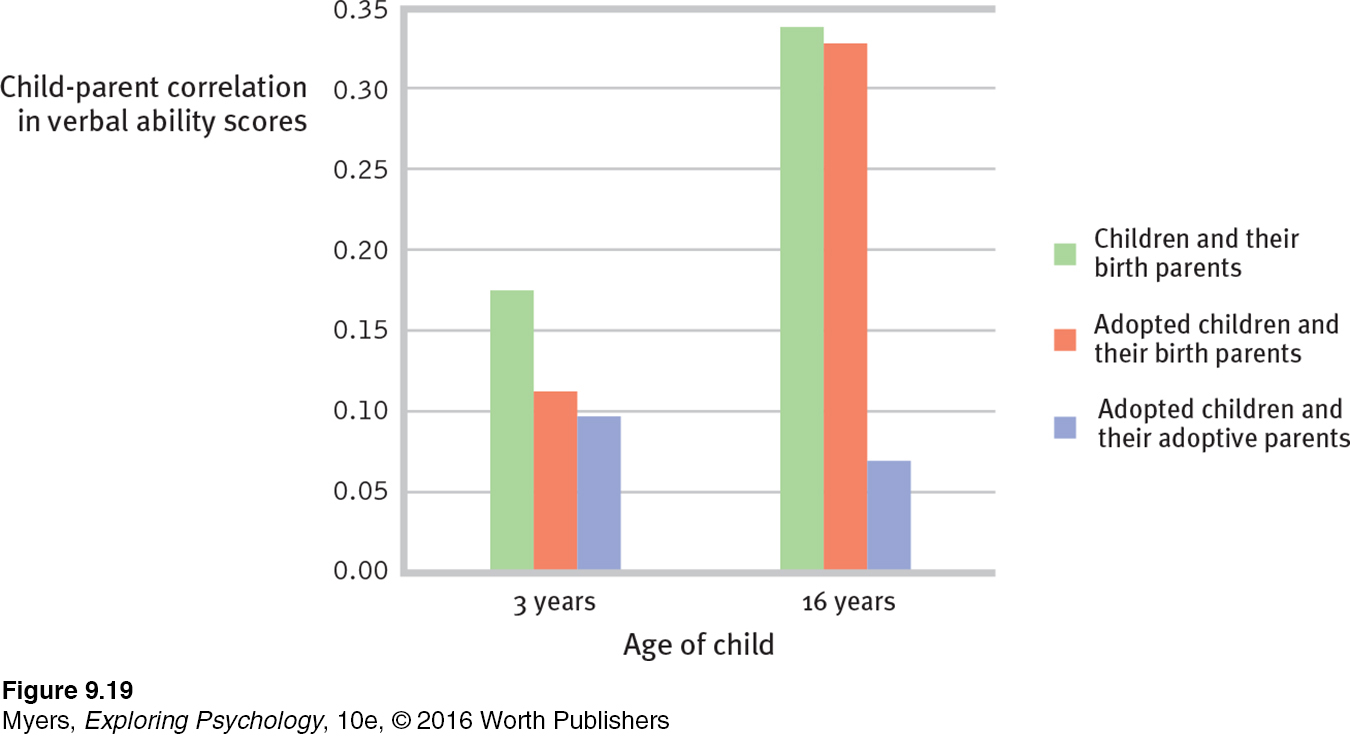
Seeking to untangle genes and environment, researchers have also compared the intelligence test scores of adopted children with those of their family members. These include (a) their biological parents (the providers of their genes) and (b) their adoptive parents (the providers of their home environment). What do you think happens as the years go by and adopted children settle in with their adoptive families? Would you expect the family-environment effect to grow stronger and the genetic-legacy effect to shrink?

If you said Yes, behavior geneticists have a stunning surprise for you. Mental similarities between adopted children and their adoptive families lessen with age, dropping to roughly zero by adulthood (McGue et al., 1993). Genetic influences—not environmental ones—become more apparent as we accumulate life experience. Identical twins’ similarities, for example, continue or increase into their eighties (Deary et al., 2009). In one massive study of 11,000 twin pairs in four countries, the heritability of g increased from 41 percent in middle childhood, to 55 percent in adolescence, to 66 percent in young adulthood (Haworth et al., 2010). Similarly, adopted children’s verbal ability scores over time become more like those of their biological parents (FIGURE 9.19). Who would have guessed?

image
Figure 9.19: FIGURE 9.19 In verbal ability, whom do adopted children resemble? As the years went by in their adoptive families, children’s verbal ability scores became more like their biological parents’ scores. (Data from Plomin & DeFries, 1998.)

356

RETRIEVE IT

Question 9.22

Eh28ftBognInQZNfOeaBof02D3O/lMIWqOfLF5bRmMP6no5fcNEXUF6EHc/0MNHJoGsDMBnmroV4pGf2YwFi681t0VYZrx+kiKBJ3MudKkK7QhUHInEL11d0nL0fI8geKhXcMWvry4UlNlK6QQiQ9BRmZdW6dthHHMWPyp1ym19PJLDYmhdshAqtcSVnH8Iox/Vy062/3iNn0i5ITOyMh/fDzvG2j8V+chTFwUTYIfiktcZ6AyOQQj2rF8qXXeFHMuWg36jDuwLwdx5VGOqVZwPqjmc=
ANSWER: a. (Heritability—variation explained by genetic influences—will increase as environmental variation decreases.)

Environmental Influences

9-23 What does evidence reveal about environmental influences on intelligence?

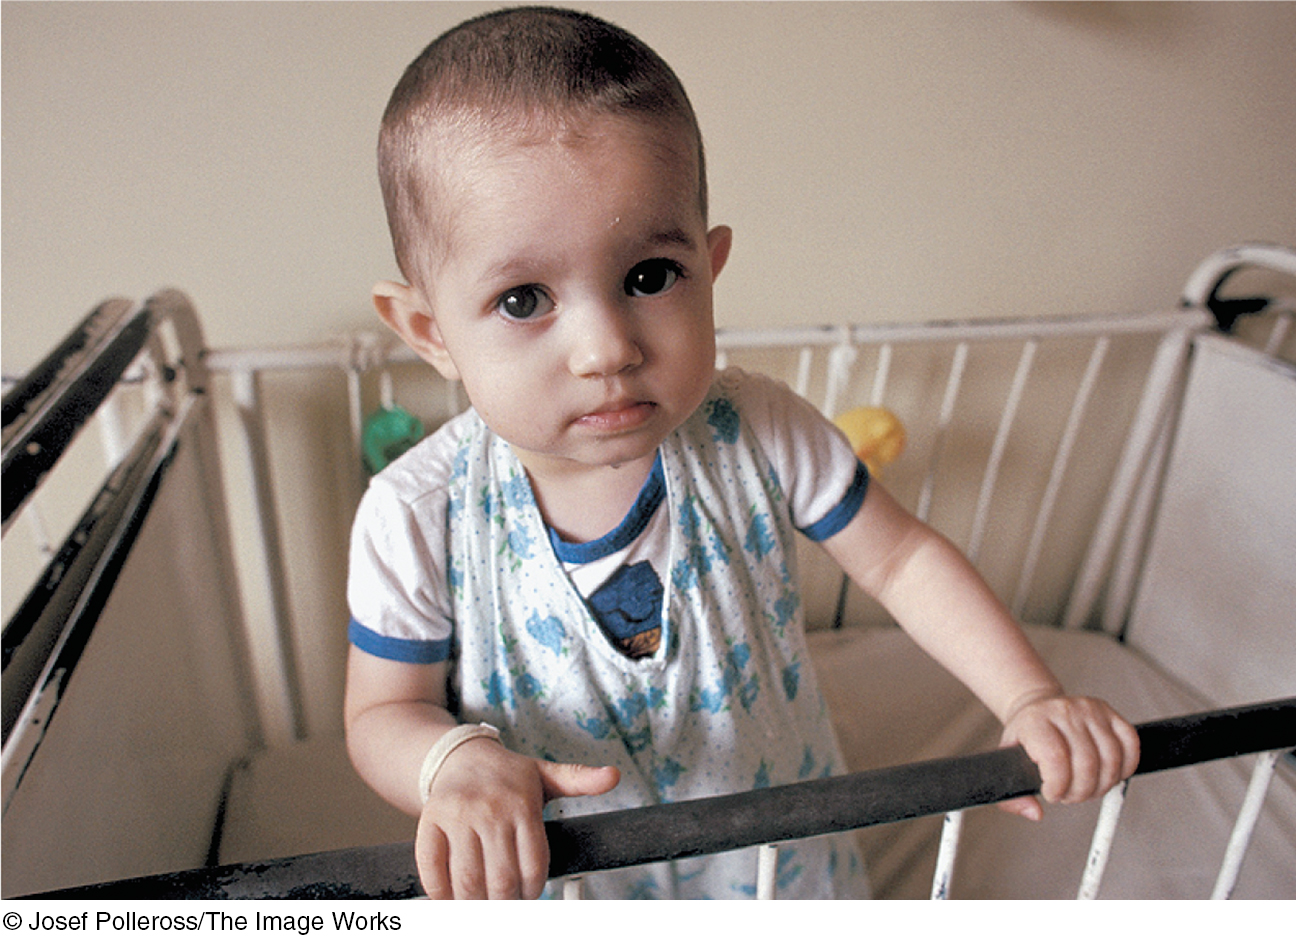
We have seen that biology and experience intertwine. Nowhere is this more apparent than in the most hopeless human environments. Severe deprivation leaves footprints on the brain, as J. McVicker Hunt (1982) observed in a destitute Iranian orphanage. The typical child Hunt observed there could not sit up unassisted at age 2 or walk at age 4. The little care the infants received was not in response to their crying, cooing, or other behaviors, so the children developed little sense of personal control over their environment. They were instead becoming passive “glum lumps.” Extreme deprivation was crushing native intelligence—a finding confirmed by other studies of children raised in poorly run orphanages in Romania and elsewhere (Nelson et al., 2009, 2013; van IJzendoorn et al., 2008).

Mindful of the effect of early experiences and early intervention, Hunt began a training program for Iranian caregivers, teaching them to play language-fostering games with 11 infants. They learned to imitate the babies’ babbling. They engaged them in vocal follow-the-leader. And, finally, they taught the infants sounds from the Persian language. The results were dramatic. By 22 months of age, the infants could name more than 50 objects and body parts. They so charmed visitors that most were adopted—an unprecedented success for the orphanage.

image
Devastating neglect Some Romanian orphans, such as this child in the Leaganul Pentru Copii orphanage in 1990, had minimal interaction with caregivers, and suffered delayed development.
© Josef Polleross/The Image Works

So, extreme conditions—malnutrition, sensory deprivation, and social isolation—can retard normal brain development. Is the reverse also true? Will an “enriched” environment give children a superior intellect? Most experts are doubtful (Bruer, 1999; DeLoache et al., 2010; Reichert et al., 2010). There is no environmental recipe for fast-forwarding a normal infant into a genius. All babies should have normal exposure to sights, sounds, and speech. Beyond that, Sandra Scarr’s (1984) verdict still is widely shared: “Parents who are very concerned about providing special educational lessons for their babies are wasting their time.”

More encouraging results come from intensive, post-babyhood preschool programs (Mervis, 2011; Tucker-Drob, 2012). Across a number of experiments, intelligence scores also rise with nutritional supplements to pregnant mothers and newborns (3.5 points), with quality preschool experiences (4 points), and with interactive reading programs (6 points) (Protzko et al., 2013).

“A high IQ and a subway token will only get you into town.”

Psychologist Richard Nisbett (quoted by Michael Balter), 2011

A child’s later schooling also pays intelligence dividends and enhances future income (Ceci & Williams, 1997, 2009). What we accomplish depends also on our own beliefs and motivation. One analysis of 72,431 collegians found that study motivation and study skills rivaled aptitude and previous grades as predictors of academic achievement (Credé & Kuncel, 2008). Motivation can even affect intelligence test performance. Four dozen studies show that, when promised money for doing well, adolescents score higher on such tests (Duckworth et al., 2011).

“It is our choices . . . that show what we truly are, far more than our abilities.”

Professor Dumbledore to Harry Potter in J. K. Rowling’s Harry Potter and the Chamber of Secrets, 1999

Group Differences in Intelligence Test Scores

357

If there were no group differences in aptitude scores, psychologists could politely debate hereditary and environmental influences in their ivory towers. But there are group differences. What are they? And what shall we make of them?

Gender Similarities and Differences

9-24 How and why do the genders differ in mental ability scores?

In science, as in everyday life, differences, not similarities, excite interest. Compared with the anatomical and physiological similarities between men and women, our intelligence differences are minor. In the 1932 study that tested Scottish 11-year-olds, for example, the girls’ average intelligence score was 100.6 and the boys’ was 100.5 (Deary et al., 2003). So far as g is concerned, boys and girls, men and women, are the same species.

Yet, most people find differences more newsworthy. Girls outpace boys in spelling, verbal fluency, locating objects, detecting emotions, and sensitivity to touch, taste, and color (Halpern et al., 2007). Boys outperform girls in tests of spatial ability and complex math problems, though in math computation and overall math performance, boys and girls hardly differ (Else-Quest et al., 2010; Hyde & Mertz, 2009; Lindberg et al., 2010). Males’ mental ability scores also vary more than females’. Thus, boys worldwide outnumber girls at both the low extreme and the high extreme (Brunner et al., 2013). Boys, for example, are more often found in special education classes, but also among those scoring very high on the SAT math test.

image
“The human computer” Indian math wizard Shakuntala Devi made it into the 1982 Guinness Book of World Records when she multiplied two randomly selected 13-digit numbers (7,686,369,774,870 × 2,465,099,745,779) to give, within seconds, the 26-digit solution: 18,947,668,177,995,426,462,773,730 (Pandya, 2013).
Barton Silverman/The New York Times/Redux

The most reliable male edge appears in spatial ability tests like the one shown in FIGURE 9.20 (Maeda & Yoon, 2013; Wei et al., 2012). The solution requires speedily rotating three-dimensional objects in one’s mind. Today, such skills help when fitting suitcases into a car trunk, playing chess, or doing certain types of geometry problems. From an evolutionary perspective, those same skills would have helped our ancestral fathers track prey and make their way home (Geary, 1995, 1996; Halpern et al., 2007). The survival of our ancestral mothers may have benefited more from a keen memory for the location of edible plants—a legacy that lives today in women’s superior memory for objects and their location.

image
Figure 9.20: FIGURE 9.20 The mental rotation test This is a test of spatial abilities. (ANSWER)
Perceptual and Motor Skills, A Group Test of Three-Dimentional Spatial Visualization , Steven G. Vandenberg and Allan R. Ruse, Volume 47, Issue 2, October 1978: pp 599–604(doi: 10.2466/pms.1978.47.2.599).

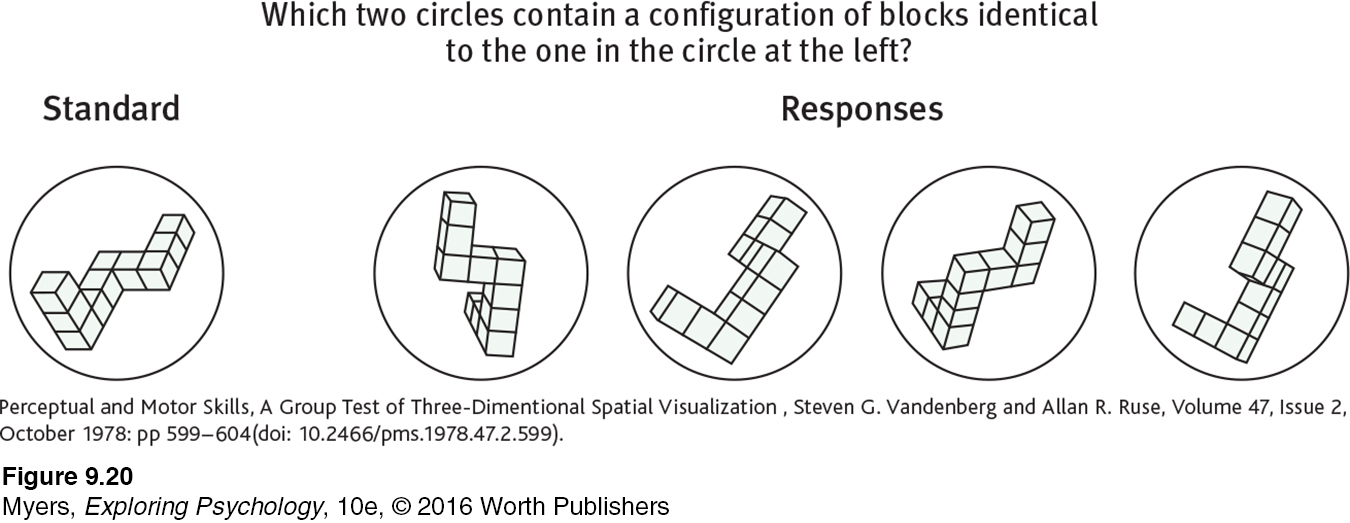
But social expectations and opportunities also matter. In Asia and Russia, teenage girls have outperformed boys in an international science exam; in North America and Britain, boys have scored higher (Fairfield, 2012). More gender-equal cultures, such as Sweden and Iceland, exhibit little of the gender math gap found in gender-unequal cultures, such as Turkey and Korea (Guiso et al., 2008; Kane & Mertz, 2012).

Racial and Ethnic Similarities and Differences

358

9-25 How and why do racial and ethnic groups differ in mental ability scores?

Fueling the group-differences debate are two other disturbing but agreed-upon facts:

There are many group differences in average intelligence test scores. New Zealanders of European descent outscore native Maori New Zealanders. Israeli Jews outscore Israeli Arabs. Most Japanese outscore most Burakumin, a stigmatized Japanese minority. Those who can hear have outscored those born deaf (Braden, 1994; Steele, 1990; Zeidner, 1990). And White Americans have outscored Black Americans. This Black-White difference has diminished somewhat in recent years, especially among children (Dickens & Flynn, 2006; Nisbett et al., 2012). Such group differences provide little basis for judging individuals. Worldwide, women outlive men by four years, but knowing only that you are male or female won’t tell us how long you will live.

We have seen that heredity contributes to individual differences in intelligence. But group differences in a heritable trait may be entirely environmental. Consider one of nature’s experiments: Allow some children to grow up hearing their culture’s dominant language, while others, born deaf, do not. Then give both groups an intelligence test rooted in the dominant language, and (no surprise) those with expertise in that language will score highest. Although individual performance differences may be substantially genetic, the group difference is not (FIGURE 9.21).

image
Figure 9.21: FIGURE 9.21 Group differences and environmental impact Even if the variation between members within a group reflects genetic differences, the average difference between groups may be wholly due to environment. Imagine that seeds from the same mixture are sown in different soils. Although height differences within each window box of flowers will be genetic, the height difference between the two groups will be environmental. (Inspired by Lewontin, 1976.)

Might the racial gap be similarly environmental? Consider:

Genetics research reveals that under the skin, the races are remarkably alike. The average genetic difference between two Icelandic villagers or between two Kenyans greatly exceeds the group difference between Icelanders and Kenyans (Cavalli-Sforza et al., 1994; Rosenberg et al., 2002). Moreover, looks can deceive. Light-skinned Europeans and dark-skinned Africans are genetically closer than are dark-skinned Africans and dark-skinned Aboriginal Australians.

Race is not a neatly defined biological category. Many social scientists see race primarily as a social construction without well-defined physical boundaries, as each race blends seamlessly into the race of its geographical neighbors (Helms et al., 2005; Smedley & Smedley, 2005). Moreover, with increasingly mixed ancestries, more and more people defy neat racial categorization and self-identify as multiracial (Pauker et al., 2009).

The intelligence test performance of today’s better-fed, better-educated, and more test-prepared population exceeds that of the 1930s population—by a greater margin than the intelligence test score of the average White today exceeds that of the average Black. One research review noted that the average intelligence test performance of today’s sub-Saharan Africans is the same as British adults in 1948, with the possibility of more gains to come, given improved nutrition, economic development, and education (Wicherts et al., 2010).

image
© Larry Williams/Corbis

359

When Blacks and Whites have or receive the same pertinent knowledge, they exhibit similar information-processing skill. “The data support the view that cultural differences in the provision of information may account for racial differences in [intelligence test performance],” reported researchers Joseph Fagan and Cynthia Holland (2007).

Schools and culture matter. Countries whose economies create a large wealth gap between rich and poor tend also to have a large rich-versus-poor intelligence test score gap (Nisbett, 2009). Moreover, educational policies such as kindergarten attendance, school discipline, and instructional time per year predict national differences in intelligence and knowledge tests (Rindermann & Ceci, 2009). Math achievement, aptitude test differences, and especially grades may reflect conscientiousness more than competence (Poropat, 2014). Asian students, who have outperformed North American students on such tests, have also spent 30 percent more time in school and much more time in and out of school studying math (Geary et al., 1996; Larson & Verma, 1999; Stevenson, 1992).

image
Nature’s own morphing Nature draws no sharp boundaries between races, which blend gradually one into the next around Earth. But the human urge to classify causes people to socially define themselves in racial categories, which become catchall labels for physical features, social identity, and nationality.
© David Turnley/Corbis; © Rob Howard/Corbis; © Barbara Bannister/Gallo Images/Corbis; © Dave Bartruff/Corbis; © Haruyoshi Yamaguchi/Corbis; © Richard T. Nowitz/Corbis; © Owen Franken/Corbis; © Sean De Burca/Corbis

In different eras, different ethnic groups have experienced golden ages—periods of remarkable achievement. Twenty-five hundred years ago, it was the Greeks and the Egyptians, then the Romans. In the eighth and ninth centuries, genius seemed to reside in the Arab world. Five hundred years ago, the Aztec Indians and the peoples of Northern Europe were the superachievers. Today, people notice Asian technological genius and Jewish cultural success. Cultures rise and fall over centuries; genes do not. That fact makes it difficult to attribute a natural superiority to any race.

“Do not obtain your slaves from Britain, because they are so stupid and so utterly incapable of being taught.”

Cicero, 106–43 B.C.E.

RETRIEVE IT

Question

2fSnK7F1pWm8kBdidqvtN1V1wR4u/GvevThoJC4G43PbJw07mgbHJyy3s16jhd7u69A6QddZdNvLG2/3Pwm87CSxGwm+hLq9CLqtwqFspQnidkDlgwd1y6cMenR3PIo986xuNkreEKj3hMq1q3M5uJzL3bGg31lJiJQNuwxzSB91bXfxKa8E1uYk4MfUmTexuuSq+asWQnfpu4vS2eHiA7enHmtMDzmzuegIiETqu7fal//cF/tt5cEAfV5r6DI6AVg9nQ==
ANSWER: Perfect environmental equality would create 100 percent heritability, because genes alone would account for any remaining human differences.

The Question of Bias

360

9-26 Are intelligence tests inappropriately biased?

If one assumes that race is a meaningful concept, the debate over racial differences in intelligence divides into three camps (Hunt & Carlson, 2007):

We have considered group differences from the first and second perspectives. Let’s turn now to the third: Are intelligence tests biased? The answer depends on the definition of bias we use.

Two Meanings of Bias

The scientific meaning of bias hinges on a test’s validity—on whether it predicts future behavior only for some groups of test-takers. For example, if the SAT accurately predicted the college achievement of women but not that of men, then the test would be biased. In this statistical meaning of the term, the near-consensus among psychologists (as summarized by the U.S. National Research Council’s Committee on Ability Testing and the American Psychological Association’s Task Force on Intelligence) has been that the major U.S. aptitude tests are not biased (Hunt & Carlson, 2007; Neisser et al., 1996; Wigdor & Garner, 1982). The tests’ predictive validity is roughly the same for women and men, for various races, and for rich and poor. If an intelligence test score of 95 predicts slightly below-average grades, that rough prediction usually applies equally to all.

But we can also consider a test biased if it detects not only innate differences in intelligence but also performance differences caused by cultural experiences. This in fact happened to Eastern European immigrants in the early 1900s. Lacking the experience to answer questions about their new culture, many were classified as “feeble-minded.” In this popular sense, intelligence tests are biased. They measure your developed abilities, which reflect, in part, your education and experiences.

You may have read examples of intelligence test items that make assumptions (for example, that a cup goes with a saucer). Such items bias the test (in this case, against those who do not use saucers). Could such questions explain cultural differences in test performance? In such cases, tests can be a vehicle for discrimination, consigning potentially capable children (some of whom may have a different native language) to unchallenging classes and dead-end jobs. For such reasons, some intelligence researchers recommend creating culture-neutral questions—such as assessing people’s ability to learn novel words, sayings, and analogies—to enable culture-fair aptitude tests (Fagan & Holland, 2007, 2009).

So, test-makers’ expectations can introduce bias in an intelligence test. This is consistent with an observation you have seen throughout this text: Our expectations and attitudes can influence our perceptions and behaviors. This is also true for the person taking the test.

RETRIEVE IT

Question

7iAutHCYiMlPW3PW8mP1iqGGA+NDULuqWzGfRJgswbcYb6do9finVuJuSjsIQtBU6Z9gB9F8u6FgR1inXraH/ysVTZtU3B94fZeu5bzm7R9KG8MBdqHvFB4w20XYxQRSJPpIbzdT9pKtSo7Nsxv0zcYAD2PLTx4O2fS+c9M/I5NGeFyZ/zCQXeWemvfdzHr2gWcsLNdcdTcAPGfAVdgmsPIisLI=
ANSWER: A test may be culturally biased if higher scores are achieved by those with certain cultural experiences. That same test may not be biased in terms of validity if it predicts what it is supposed to predict. For example, the SAT may be culturally biased in favor of those with experience in the U.S. school system, but it does still accurately predict U.S. college success.

Stereotype Threat

361

stereotype threat a self-confirming concern that one will be evaluated based on a negative stereotype.

If, when taking an intelligence test or an exam, you are worried that your group or “type” often doesn’t do well, your self-doubts and self-monitoring may hijack your working memory and impair your performance (Schmader, 2010). This self-confirming concern that you will be evaluated based on a negative viewpoint is called stereotype threat, and it may impair your attention, performance, and learning (Inzlicht & Kang, 2010; Rydell, 2010).

When Steven Spencer and his colleagues (1997) gave a difficult math test to equally capable men and women, women did not do as well—except when they had been led to expect that women usually do as well as men on the test. Otherwise, stereotype threat affected their performance. And with Claude Steele and Joshua Aronson, Spencer (2002) again observed stereotype threat when Black students were reminded of their race just before taking verbal aptitude tests and performed worse. Follow-up experiments have confirmed that negatively stereotyped minorities and women may have unrealized academic potential (Nguyen & Ryan, 2008; Walton & Spencer, 2009).

Critics argue that stereotype threat does not fully account for Black-White aptitude score differences or the gender gap in high-level math achievements (Sackett et al., 2004, 2008; Stoet & Geary, 2012). But it does help explain why Blacks have scored higher when tested by Blacks than when tested by Whites (Danso & Esses, 2001; Inzlicht & Ben-Zeev, 2000). It gives us insight into why women have scored higher on math tests with no male test-takers present, and why women’s online chess performance drops sharply when they think they are playing a male opponent (Maass et al., 2008). It also explains “the Obama effect”—the finding that African-American adults performed better if they took a verbal aptitude test immediately after watching then-candidate Barack Obama’s stereotype-defying nomination acceptance speech, or just after his 2008 presidential victory (Marx et al., 2009).

“Math class is tough!”

“Teen talk” talking Barbie doll (introduced July 1992, recalled October 1992)

Steele (1995, 2010) concludes that telling students they probably won’t succeed (as is sometimes implied by remedial “minority support” programs) functions as a stereotype that can erode performance. Minority students in university programs that have challenged them to believe in their potential, to increase their sense of belonging, or to focus on the idea that intelligence is malleable and not fixed, have produced markedly higher grades and have had lower dropout rates (Walton & Cohen, 2011; Wilson, 2006).

These observations would not surprise psychologist Carol Dweck (2012a,b, 2015). She reports that believing intelligence is changeable fosters a growth mind-set, which focuses on learning and growing. To foster this mind-set, Dweck teaches early teens that the brain is like a muscle that grows stronger with use as neuron connections grow. Praising children’s effort rather than their ability also encourages their growth mind-set and their attributing success to hard work (Gunderson et al., 2013). Fostering a growth mind-set makes teens more resilient when others frustrate them (Paunesku et al., 2015; Yeager et al., 2013, 2014). Indeed, superior achievements in fields from sports to science to music arise from the combination of ability, opportunity, and disciplined effort (Ericsson et al., 2007).

image
Stereotype threat Academic success can be hampered by self-doubt and self-monitoring during exams, which may impair attention, memory, and performance.
Roy Mehta/Iconica/Getty Images

362

Real world studies confirm that ability + opportunity + motivation = success. High school students’ math proficiency and college students’ grades reflect their aptitude but also their self-discipline, their belief in the power of effort, and a curious “hungry mind” (Murayama et al., 2013; Richardson et al., 2012; von Stumm et al., 2011). Indian-Americans won all seven national spelling bee contests between 2008 and 2014, an achievement likely influenced by a cultural belief that strong effort will meet with success (Rattan et al., 2012). Believing in our ability to learn, and applying ourselves with sustained effort, we are likely to fulfill our potential.

image
U.S. spelling champs Vanya Shivashankar, 13, and Gokul Venkatachalam, 14, celebrate their co-winning the 2015 Scripps National Spelling Bee. Vanya correctly spelled “scherenschnitte” and Gokul “nunatak.”
Alex Wong/Getty Images

“Almost all the joyful things of life are outside the measure of IQ tests.”

Madeleine L’Engle, A Circle of Quiet, 1972

* * *

Perhaps, then, our goals for tests of mental abilities should be threefold.

“[Einstein] showed that genius equals brains plus tenacity squared.”

Walter Isaacson, “Einstein’s Final Quest,” 2009

The point to remember: There are many ways of being successful: Our differences are variations of human adaptability. Life’s great achievements result not only from “can do” abilities (and fair opportunity) but also from “will do” motivation. Competence + Diligence → Accomplishment.

What time is it now? When we asked you (in the section on overconfidence) to estimate how quickly you would finish this chapter, did you underestimate or overestimate?

RETRIEVE IT

Question

sCjVLVIjjSe4BNciFHpD7rAmN+VtIYp9EVEQXD21yviRYSPAlSb9maZ2wilizUkAmg1jn/HrLh3UNjnfEf/W3t/9Uqi1OLx3CODZ7zRtLyo0hYLN47e5+AdPj9THLEr0l164Q05CuPTbTXE1LjxwVZJlLfB2EqHxQZFBzXxAcl86/XqtmoIc5eb/ZVc3hg8dz6aWEzT/AbB1W7Y9Io+HxugEGllU2zPUzyKNlOrgE7CC0WB5vcfluQ==
ANSWER: stereotype threat

REVIEW Genetic and Environmental Influences on Intelligence

Learning Objectives

363

Test Yourself by taking a moment to answer each of these Learning Objective Questions (repeated here from within the chapter). Research suggests that trying to answer these questions on your own will improve your long-term memory of the concepts (McDaniel et al., 2009).

Question

9oIU1NYzPMZkjNv3WCb7K2cnGQV5qoqZSbl9Pvtz3DnYKu1hFvZgCY6EaSxpQ4QYkCwLlQ6jh/iHlq9C3UOUs8cK/oeJlzyFyL5GE96Sem+wbUhkPFzR5Dc6QGDsB1WuMdsro+3Zy1UTT2sfiB7cqEMhAkGaqbSMrueG5YGsgEfzgh6F+ufXBnDIg2YrXMHxnZGW0iTsgUN5WFk3lTxJq1dxnNyl+9NNLOftAIS8E3Ujh7Rxsbfepa25QPGW2RsQexxv/Vg/IkZPTSf0
ANSWER: Studies of twins, family members, and adoptees indicate a significant hereditary contribution to intelligence scores. Intelligence seems to be polygenetic, and researchers are searching for genes that exert an influence. Heritability is the proportion of variation among individuals that can be attributed to genes.

Question

UzmTT2SNJzP/1LJZbSo5l8jhI0TroMlq3YmUI0Gh1mM6GpSLj3gLEf5iRrKHcq4AMXj8Qr2knAEu7vJ9HfQmKR7a1jLIk7HqUCCzEgizpAluX/nhasENDKfVi19MoCinCPbh3LJVPHCFXMq9Ypy9sFZEG6RyWulX5uOE/kTExgWhii3i7wkLr3JHa3goNFQUSH4e4ejcdktRQzd0Pa20iE51/ZGWEQ8y29+4/SYPbzLzHEJTXMpRejj3h0M=
ANSWER: Studies of twins, family members, and adoptees also provide evidence of environmental influences. Test scores of identical twins raised apart are slightly less similar (though still very highly correlated) than the scores of identical twins raised together. Studies of children raised in extremely impoverished environments with minimal social interaction indicate that life experiences can significantly influence intelligence test performance. No evidence supports the idea that normal, healthy children can be molded into geniuses by growing up in an exceptionally enriched environment.

Question

OnjL8cY/CO0RgjH3jv6BoOKiDZL3T6MBup4xBEFZtSIMOx66nqQpUYrR3Cx/OH2xVX2fZ4rrtXt8mxu6Bs4rnyVFDtzsjYFiiSlwBzS0GPSEGueN619+cFylVG2yxPfmWU4jXE8NbjXJ/kuRRjcwnLnW5XTYDzS2o/JxzOjz96JTbz7uMaQIYst7ogCJJvazSpsOJj1nmDsx39oRLo5LDnNhvRC9fvSwFjtC08NANro=
ANSWER: Males and females tend to have the same average intelligence test scores, but they differ in some specific abilities. Girls are better spellers, more verbally fluent, better at locating objects, better at detecting emotions, and more sensitive to touch, taste, and color. Boys outperform girls at spatial ability and related mathematics, though in math computation and overall math performance, boys and girls hardly differ. Boys also outnumber girls at the low and high extremes of mental abilities. Evolutionary and cultural explanations have been proposed for these gender differences.

Question

FHnX0V/bTtTAhWveqcfvzt3J8aDGVEv3JZtRVS5GZ+cQs1ZXkddC+v2+CZ9pugKvgbrkzwxP9y21CTgSCHE/9+PbtPsdHfktKcDJaxFmJRR+zvRSWOvcwemRu/PW41hZx+Q1dw3nG4KIoomuJetsKq8ojdG+IkyVUheTTU2PZCpF7+nFLxSZ6WbtoM1+QaRpuZyCqnGdJ2loXdXjRdbSShFTSltI0hW9y1qvN3xOfRZgX7+DOpHjtAdopjM=
ANSWER: Racial and ethnic groups differ in their average intelligence test scores. The evidence suggests that environmental differences are responsible for these group differences.

Question

8blK+9zls9lvW5KtGacJTTYeEJZQA28Xem1UTAUOGB4gXCS0AwNjQOjiSSbcba284QJ+4bj5LSVjHhM0KKyhZ6exPJrMp4Vlc1ONH8Z6FjiCj/5amWQbKnnsWd6UnXPXQ2MKMHa4HhdCZgUQAClbg3AD2qpnA+XIHdc5CM/ozeLJ+kLcX/xunSC7tblzOpxqsoFkhod74ysLaH/GRU4nkMuHRXc=
ANSWER: Aptitude tests aim to predict how well a test-taker will perform in a given situation. So they are necessarily “biased” in the sense that they are sensitive to performance differences caused by cultural experience. By “inappropriately biased,” psychologists mean that a test predicts less accurately for one group than for another. In this sense, most experts consider the major aptitude tests unbiased. Stereotype threat, a self-confirming concern that one will be evaluated based on a negative stereotype, affects performance on all kinds of tests.

Terms and Concepts to Remember

Test yourself on these terms.

Question

IaaDn63ALsPvl+WNNC/6pW7R6Y9hTACtiRbpSQjxOIQ3qhZ1Wdt06tE11NwN97widUz9clLsMxPCBj8TYgBTAEKvFodplae5o4bAvn7GIfvFmXO4NeMrnEQhwz2Ic52Xx0jfmMk47nyczwKJAjzIosYrKJWDhABa06CIk5gKQ1lQPnS8z6Z2eJFXgGrQ0uRlysHQ8lP4ll2dg/OoG0TpZu6gfGtIPUjucxNcnN48/ZQfQuVhsQLRgch/7S+TI9GQMkf7N38ZCMOryw8tANP02JYWedY75ZlYoL3cAlmqNoKoOdI/wIFOjmcxZD42PdAKabqLny/erJoNYDemv3qsm2cXNNxROH8fYQ9K5rAhm87w/mSDPsSHhGdHunPezPaGIYsOjBX7xyzMQm8sbPuqse2ePsfChWX7tG0WgsZNvtBpciKQu/BAa4LEahzTfHn3KBeJu84BTCqkWLDSa5B1oflq78gjhiwhQKdBwRr4/7c9OIh0

Experience the Testing Effect

Test yourself repeatedly throughout your studies. This will not only help you figure out what you know and don’t know; the testing itself will help you learn and remember the information more effectively thanks to the testing effect.

Question 9.23

qaYzlAhHKbibHUwv9kQhoS4eE04Wa+vi3tB7kX4O4c8Ev73SnD+YkKX/Ky6qZg6Tm2YmNx5zIoXYb234wEDqrcjeun6psKIVcVUIRhDh8s26cI6If26Q3ib1zDds/hEVmgtJo6g5Hw3mjyemGK/rPA99f+n5mm1uY/iD3lRVi8uwWolV2TVIIXYAoUQvBFS95CqiNo3IdgYFVVM6GJrUuRxDECl+a01GOf5id6s0lXOYbfAf/i69JdKZX6DNOLltmEX4Nc5TDXp2GqXgS6NtrDTOWgj/uEQ2sncEhg1WVk/qN6NL7TRT28gW5Qq8z9yJYTlyDb4uGNP28YvlhNbzTmh61DAfc25rQtt4HZryJX/wMiqzKaXCUmBj1zg9KS+GDjGrBkRTtw2xCK+9Rw37LNRyQUQbhxqfOodm8LALVG/n7ekvfRXufrXaITnWA33jpLwbNJFpQrxyIf9ZVeXsjadhxZFmbNg2iozeyBeL+E2hs74sSu1RciDs4huASJ0W9d9ZO9a+WW07U+oYEK4fFxt84wHdP52xXaBGGyIpRQqbNZXSSH5pEcdOyW86LqE2gmgq15//rs+/aSeK+4QaA603xkv0ApDsMjhIbWaUXqS0nxSxVhaiqpXk9Fjyd8mJ

Question 9.24

udA8N7R1DpHnsHj1cFjLgVZJwXQbBmsOdI82t47V3H3qpr0T3uBKRuxFXLw3tqan/GfRA4tluyt9VyFBvgtzH4HEpkcKME8eSKWUf6l+IRcDPw13LPlz7tFF56jZyrsWRCaj1yS/Lz6VHC+hFwEjesmSX6mdPgkEKNOQT4cAw1k3vatNhwfnrhD57VyGgoJ6LYHVpjjRIwNkHppt11qoCZOAMyspmpoNWseJQV5YBHzxU888LdASVy4Hzvapz1SDlAR+y0YP68PAEDsz+1craca/1EDgTk6Beuz123u8QzSmq/1DT2jxvgWtqgmxLxmlzhBQKlWmEZGHNjqk2EjIsMyPgZv6SCqfj6rZBixRi2gLQBG/FNw48Vc8Sko1sDhZSV5DjVWjiHDf6pXa1I4t6ZK+k9Wx2hh083pzBPpcX1NJwDth5DfPVJye4CVbufzM2CUU4IfhTsTrbMn0GGyqIjX+9871oDDyYMCOL+i+FPwFZRdNABHIMQvAGEnC1vRfYOlBh7sJbecdZjTegvTR45s4L8jpMRVdxu354YdEnP8VaNcte+r4LZ3a3EuZjqGtd26uRX1tn2s=

Question 9.25

Yj247aO6X1YiUN3hbaAq+CA4gNhBcIz9aNV6WE1phYI5ADp9iIx6DKQaVvbDGJcvX29Rbsa6512M1kCMh548rP7iPIkCiKIsDdkL79xXTwd8Bf3eUTfp3fQ6BGPrAUdPXr14Qok4Hk2+f0Z3deHGbbyZ/jLH5UgeRftlXN6P5qbuzxIapgLmyhXimd0OsPT1if/cUs8SkY8sdY1CTS8zJEtFFv2C2MmEixRtrGrW7mib9hkw1paHk8aY3/oLVOF1rKePulXVzZV3hs3FgyeGsj7Q+ELBEMnsLJXWofUbR0HRGWSDrNHf2IbbVutpHD2pk3YHRxL8AkTXFjiEeNPcS9vZeaG6PZB9j66bbhv+MDohiZC2cYX2cCSHLNkdpfcX6aci+Qam6+Vxl+2xuvlHGnxaPknBAe+RRGrEQWyyKA1QZ6cdkf8uaaizVUDwMqsV+lbHHPpZ8iKa6AC3y+EQZGfZnT8VOWpG9xQTggsYjhg=

Question 9.26

4. fHy8Vt+atfVWN/fnHD1hJGCz9uHo3eYl can lead to poor performance on tests by undermining test-takers' belief that they can do well on the test.

Use image to create your personalized study plan, which will direct you to the resources that will help you most in image .