Figure 12.1:
Figure 12.1
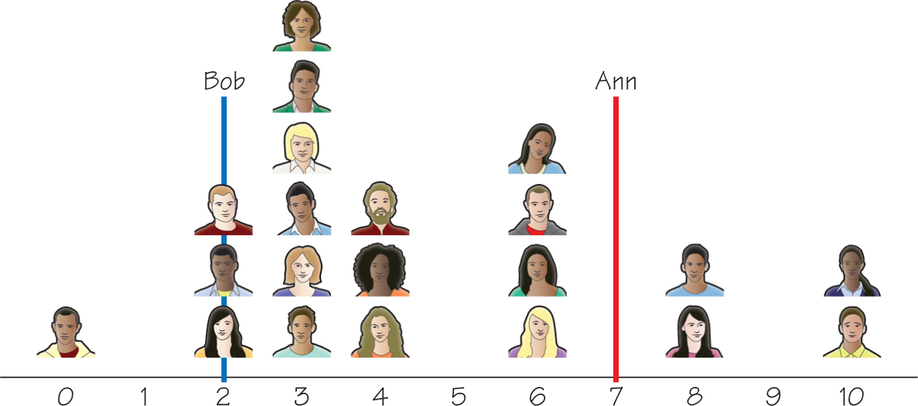
A graphical representation of the discrete distribution from
Table 12.5
.