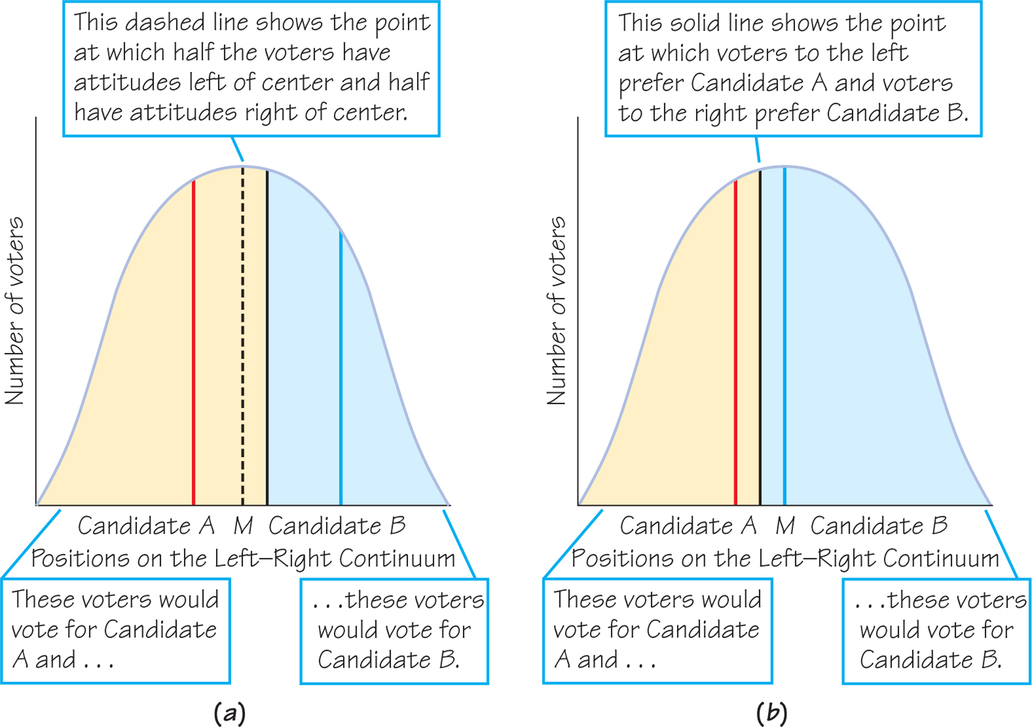
Figure 12.4: Figure 12.4 Spatial model of two-candidate voting with a continuous distribution of the voters’ attitudes. (a) Candidate wins the election because more voters (tan shading) vote for Candidate than vote for Candidate (blue shading). (b) Candidate announces a policy at the median of the continuous distribution. Candidate now wins the election.