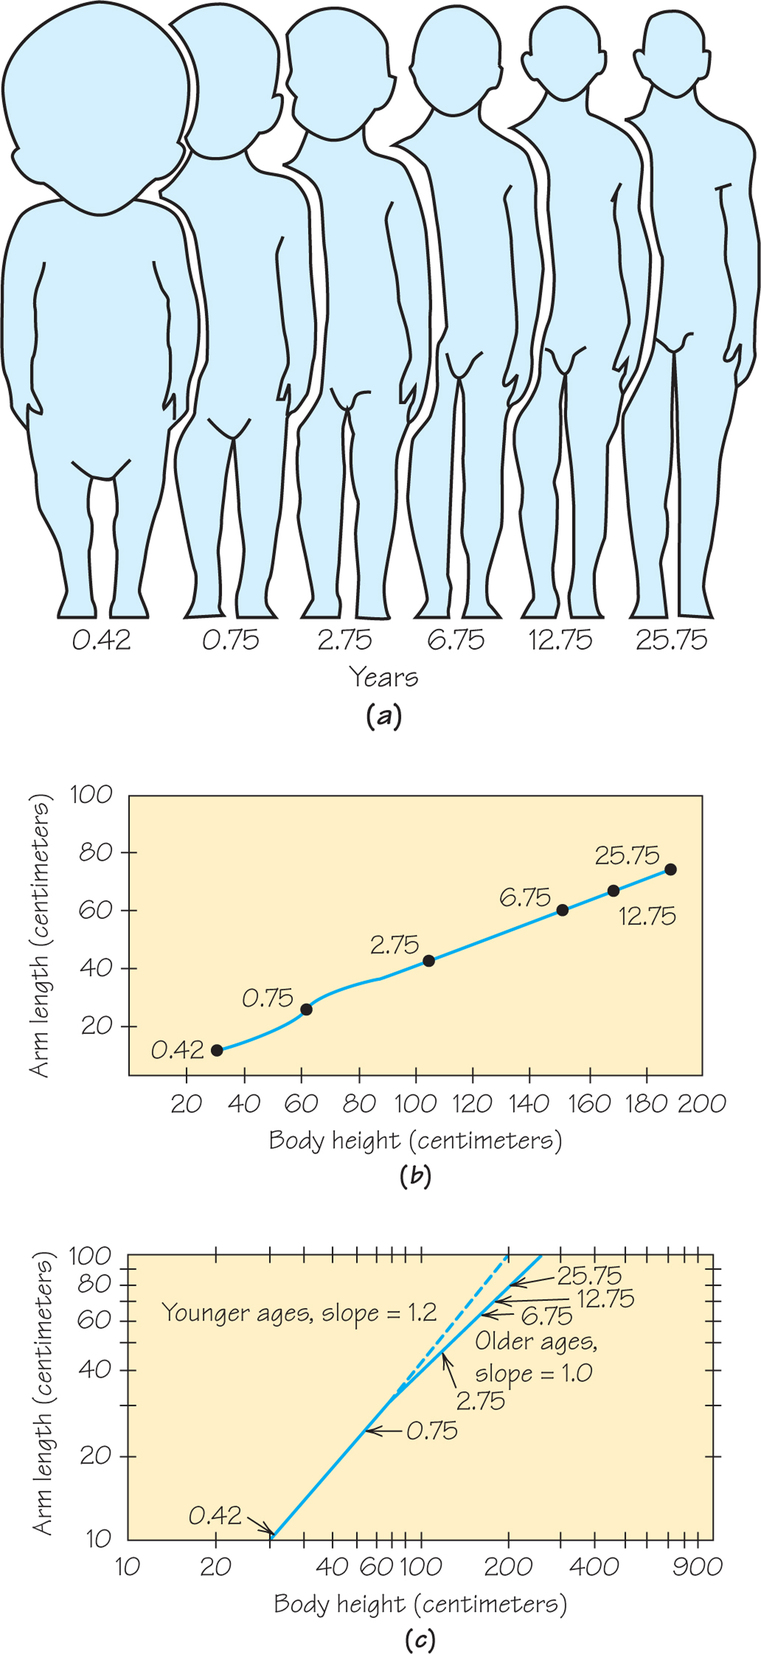
Figure 18.14: Figure 18.14 (a) The proportions of the human body change with age. (b) A graph of human body growth on ordinary graph paper. The numbers shown beside the points indicate the age in years; they correspond to the stage of human development shown in part (a). (c) A graph of human body growth on log-log paper.