Figure 2.15:
Figure 2.15
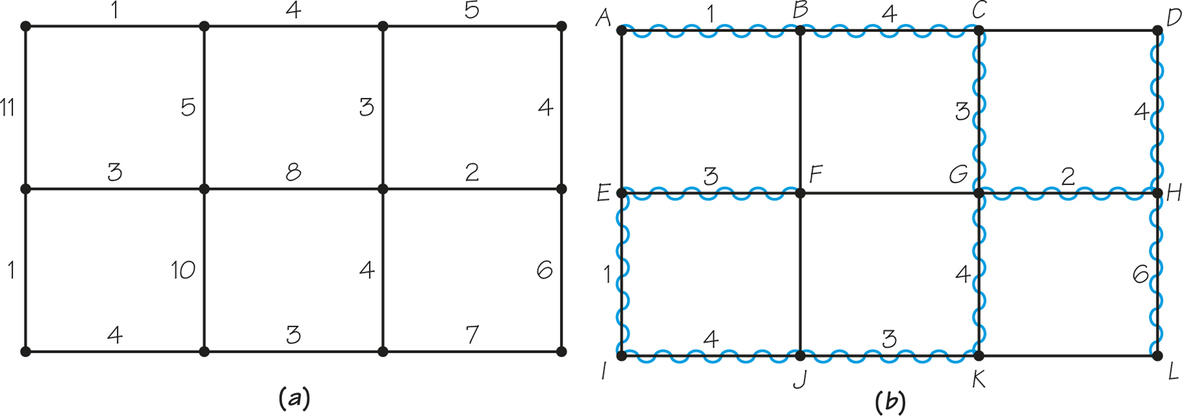
(a) A graph showing costs for construction of roads between houses. (b) Wiggly edges show a minimum-cost spanning tree for the graph in part (a).