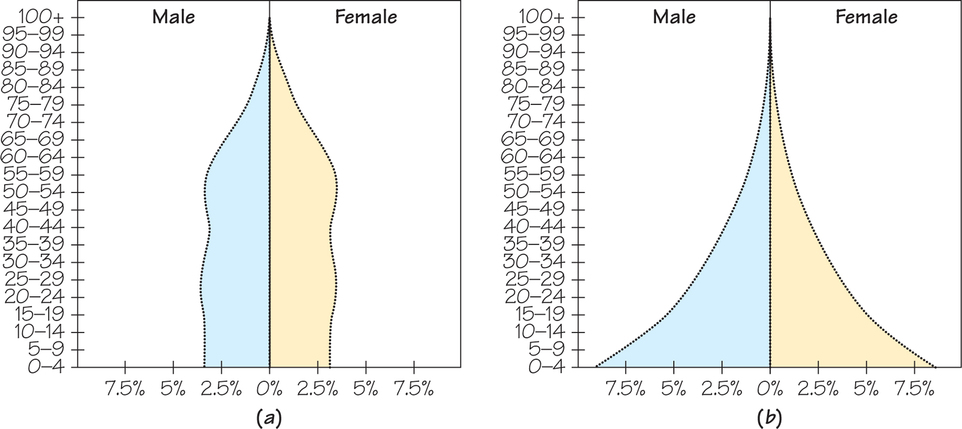
Figure 23.1: Figure 23.1 Graphs of populations in 2015, grouped by age and gender, for (a) the United States and (b) Nigeria. The horizontal scales are in percentages, not in absolute numbers, so in both graphs the total area for the population is the same (100%). However, the U.S. population was 321 million, while that of Nigeria was 184 million. (Data from populationpyramid.net/)