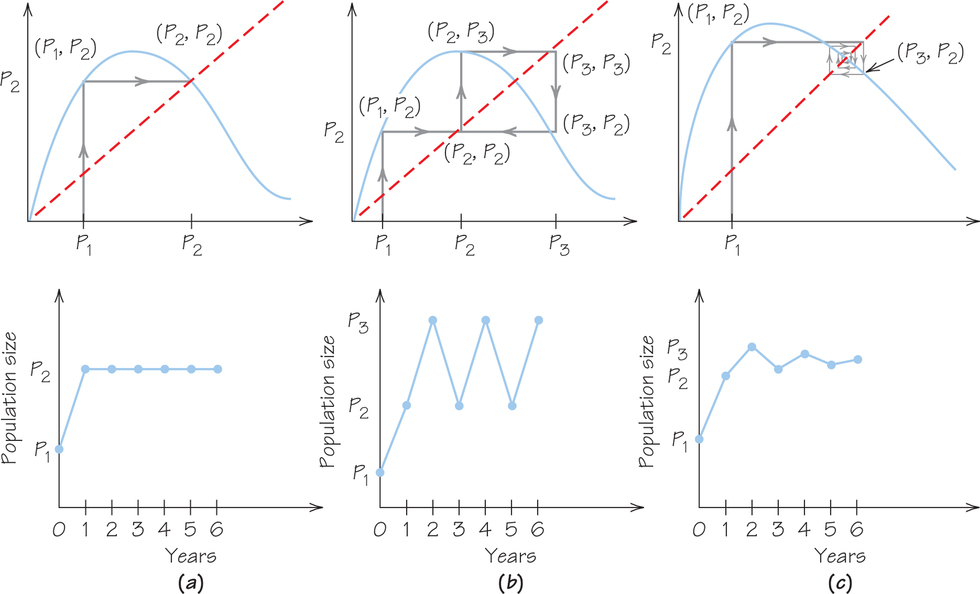
Figure 23.12: Figure 23.12 Examples of the dynamics, over time, for the same reproduction curve but different starting populations. (a) The population goes in one year to the equilibrium population and stays there year after year. (b) After initial adjustment, the population cycles between values over and under the equilibrium population. (c) The population spirals in toward the equilibrium population.