Figure 23.6:
Figure 23.6
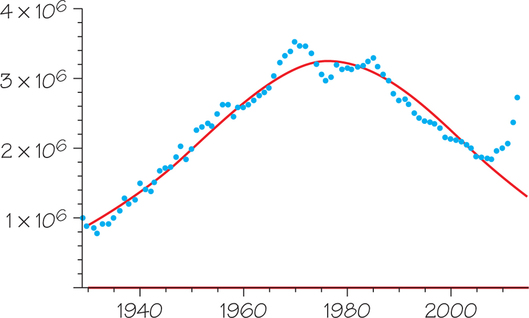
Annual U.S. crude oil production (blue dots) in billions of barrels versus year, with production as predicted by a logistic model (solid red curve) that assumes ultimate production of 240 billion barrels.