Figure 23.7:
Figure 23.7
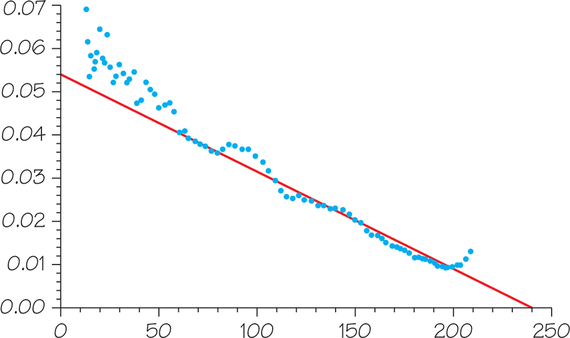
Data (blue dots) for U.S. oil production with line (solid red line) based on Hubbert’s logistic model, which depicts the equation
.