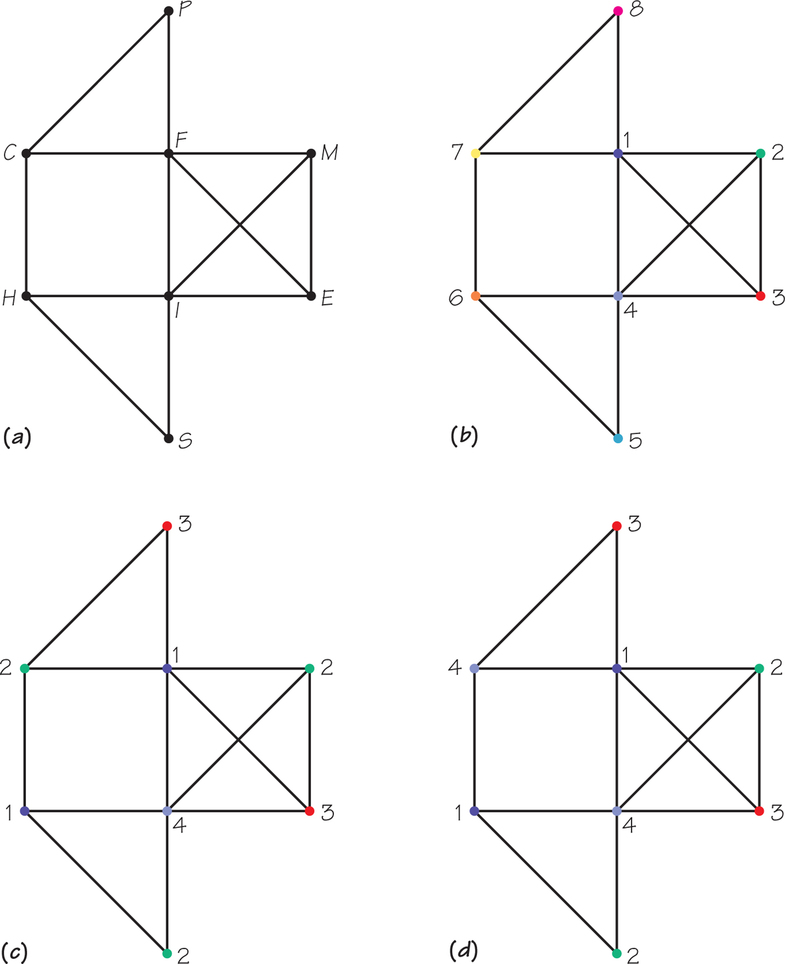
Figure 3.22: Figure 3.22 (a) A graph used to represent conflict information about courses. When two courses have a common student, an edge is drawn between the vertices that represent these courses. (b) A coloring of the scheduling graph with 8 colors, representing 8 time slots. Using this coloring would lead to a schedule where 8 time slots are used to schedule the examinations. This number is far from optimal. (c) A coloring of the scheduling graph with 4 colors. This translates into a way of scheduling the examinations during 4 time slots, and it is not possible to design a schedule with fewer time slots. However, this schedule calls for the use of three different rooms, because three examinations are scheduled during time slot 2. (d) A coloring of the scheduling graph with 4 colors. This means that the examinations can be scheduled in 4 time slots. However, because each color appears only twice, all the examinations can be scheduled in two air-conditioned rooms.