EXAMPLE 14![]() Calculating Standard Deviation Using a TI-84 Graphing Calculator
Calculating Standard Deviation Using a TI-84 Graphing Calculator
Next, we compare the fund from Example 12 (Table 5.8) with a different one—the Cohen & Steers Realty Shares (symbol: CSRSX), a mutual fund that invests in real estate investment trusts. Table 5.10 displays its calendar year total returns (in percentages) for the same 10-year period.
| 2004 | 2005 | 2006 | 2007 | 2008 | 2009 | 2010 | 2011 | 2012 | 2013 |
|---|---|---|---|---|---|---|---|---|---|
| 38.48 | 14.88 | 37.13 | −19.19 | −34.40 | 32.50 | 27.14 | 6.18 | 15.72 | 3.09 |
To calculate the mean and standard deviations for these data, we turn to a TI-84 graphing calculator.
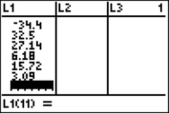
Step 1: Press STAT 1 (for EDIT). Enter the 10 percentages into list L1 (be sure to clear out any old data first). Here’s a screen shot after entry of the last data value:
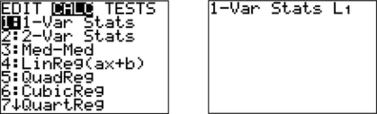
Step 2: Press STAT and enter the command for 1-var Stats.
Step 3: Press ENTER to obtain the mean and standard deviation. Press the down arrow to obtain the five-number summary.
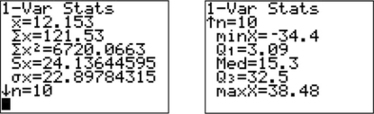
Now we are ready to compare the results for the Cohen & Steers Realty Shares (CSRSX) with the results for PIMCO Total Return A (PTTAX). On the one hand, the mean of the 10 CSRSX numbers is approximately 12.15%, which is more than double the mean from the PTTAX data. However, it comes with a tradeoff—a much higher standard deviation of approximately 24.14%. Scanning the numbers in Table 5.10, we see the dramatic lows and highs that make this fund feel like a rollercoaster ride! Knowing how to interpret these numbers is critical when making investment choices to fit your financial goals and tolerance for risk.