EXAMPLE 6![]() Patterns in Traffic Density
Patterns in Traffic Density
Consider the distribution of the weekday traffic density on a portion of the Massachusetts Turnpike. The histogram shown in Figure 5.8 is based on class intervals of 4 hours. Other than showing that peak traffic density is between 4 p.m. and 8 p.m. (16 hours after midnight to 20 hours after midnight) and that traffic density is very low between 12 A.M. and 4 A.M., the histogram is not very informative.
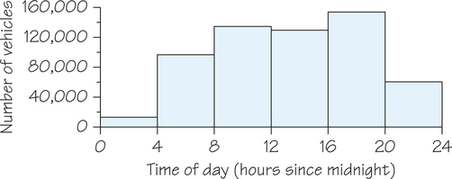
Figure 5.8 Histogram of traffic density in 4-hour intervals.
In Figure 5.9, the class interval widths have been reduced to 1 hour each. In this histogram, the increased traffic densities during morning rush hour (about 7 A.M. to 9 A.M.) and evening rush hour (about 3 P.M. to 7 P.M.) are clearly visible.
Page 194
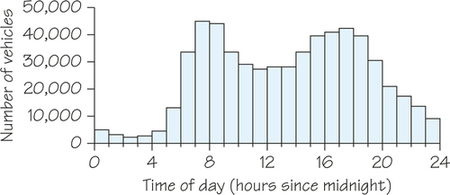
Figure 5.9 Histogram of traffic density in 1-hour intervals.
[Leave] [Close]