Figure 5.1:
Figure 5.1
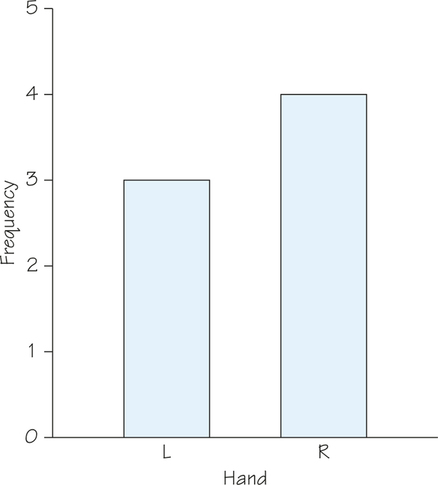
Bar chart of HAND data from
Table 5.1
.