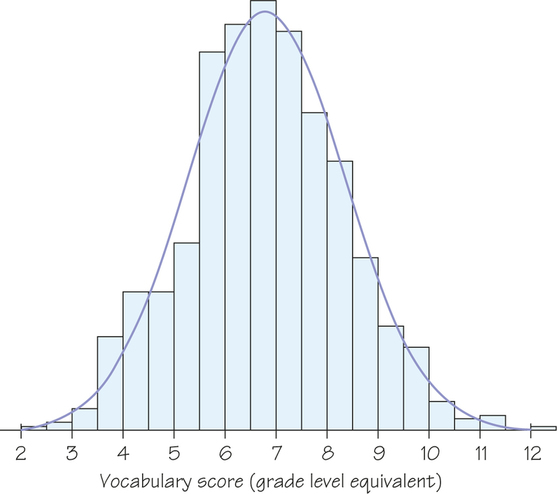
Figure 5.19
A histogram of the vocabulary scores of 947 seventh-grade students in Gary, Indiana. The smooth curve shows the overall shape of the distribution.
[
Leave
] [
Close
]
Read on
▣