Figure 5.22:
Figure 5.21
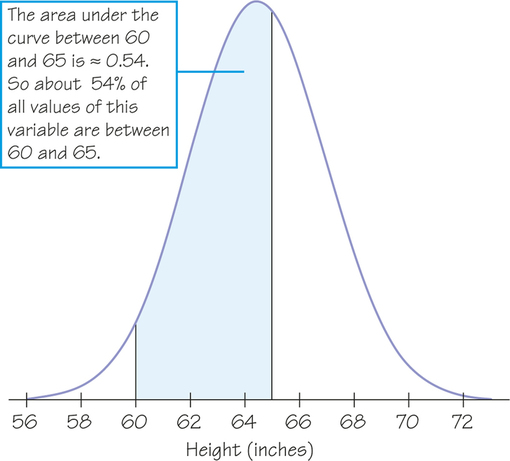
Areas under a normal density curve describe a normal distribution. This normal curve describes the distribution of heights of American women.