Figure 5.29:
Figure 5.27
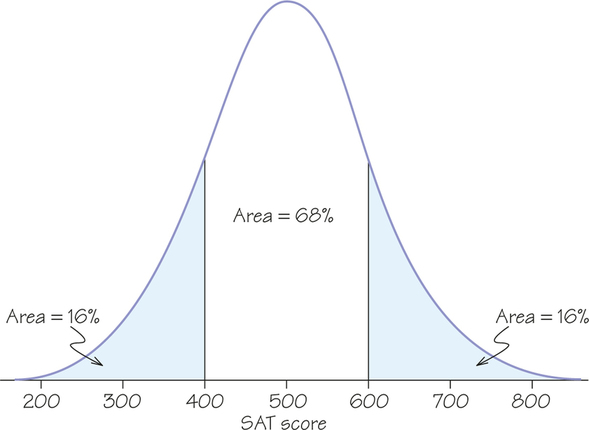
sing the 68-95-99.7 rule to find the percentage of SAT section scores that are above 600. This normal curve has a mean of 500 and a standard deviation of 100.