Figure 5.34:
Figure 5.32
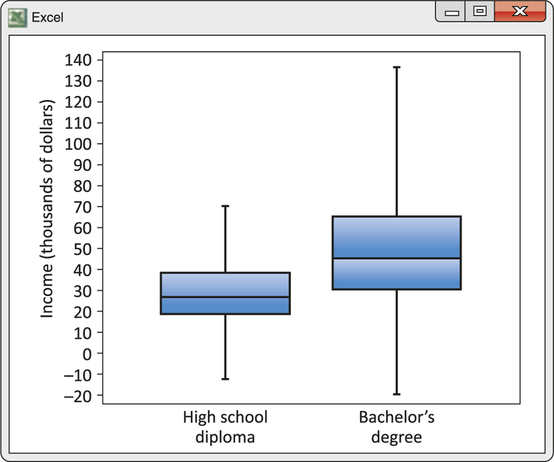
Boxplots comparing the incomes of full-time workers aged 25 to 64 years at two levels of education. The top 5% of incomes in each group are omitted.