Figure 6.19:
Figure 6.19
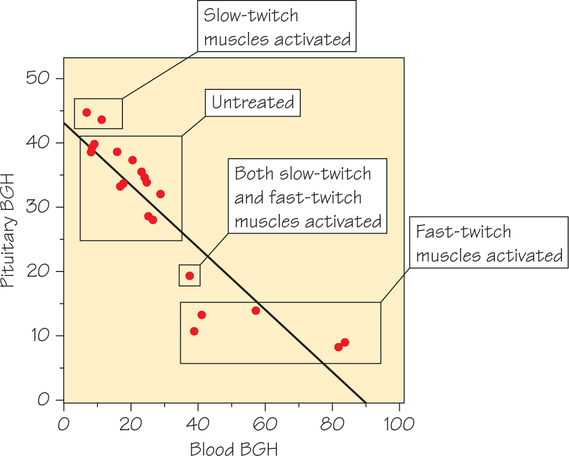
Scatterplot of BGH level in pituitary tissue versus BGH level in the blood with specific groups of rats identified by treatment.