Figure 6.2:
Figure 6.2
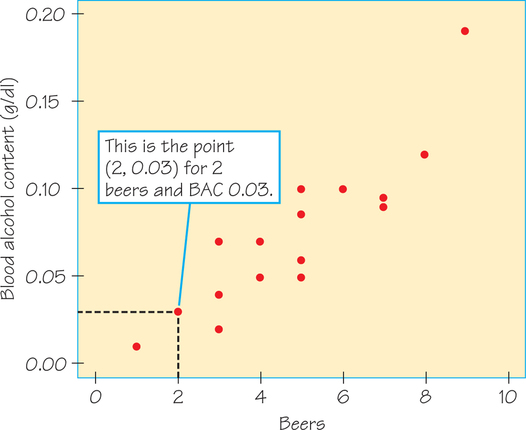
A scatterplot of BAC (response variable) against the number of beers a student drinks (explanatory variable).