Figure 6.20:
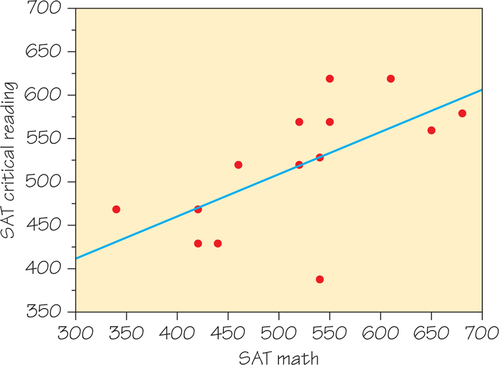
Figure 6.20
A
scatterplot
of the SAT Critical Reading test scores (the
response variable
) against SAT Math test scores (the
explanatory
variable
) of 15 high school seniors (applies to Skills Checks 7–9).