Figure 6.5:
Figure 6.5
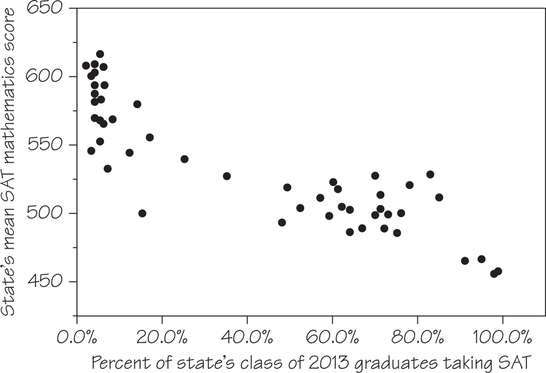
A scatterplot of states’ mean SAT Mathematics scores (the response variable) against the percentage of states’ class of 2013 high school graduates who take the SAT (the explanatory variable).