Figure 7.1:
Figure 7.1
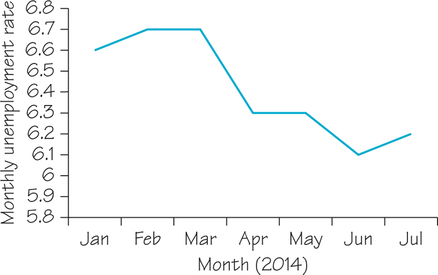
Line
graph
showing the monthly unemployment rates calculated from CPS data for the first seven months of 2014.