Figure 7.6:
Figure 7.6
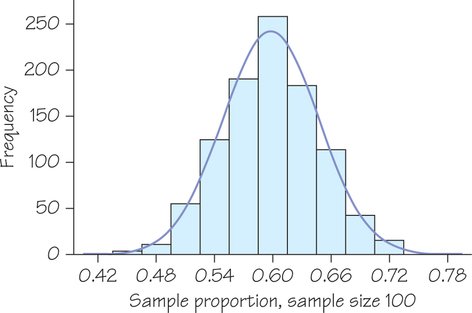
Draw 1000 SRSs of size 100 from a population with proportion
of “Agrees.” The histogram shows the distribution of the 1000 sample proportions
.