Figure 7.9:
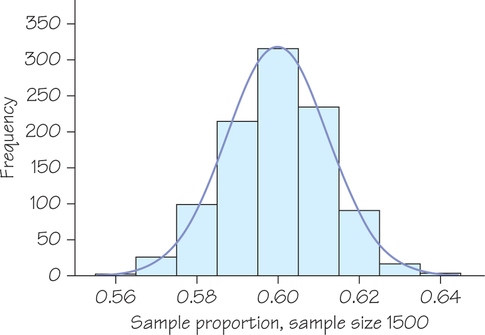
Figure 7.9
Histogram of the same data used for
Figure 7.7
. The horizontal scale has been changed to better show the normal shape of the data.