Figure 8.26:
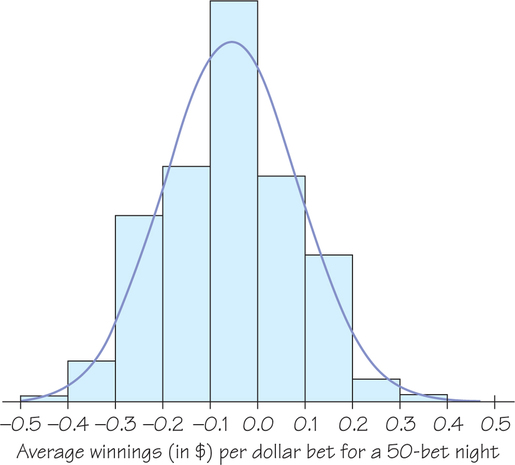
Figure 8.26
(Approximately normal) histogram of a gambler’s winnings from a simulation of 1000 nights, where each night had 50 bets on red (or black) in roulette.