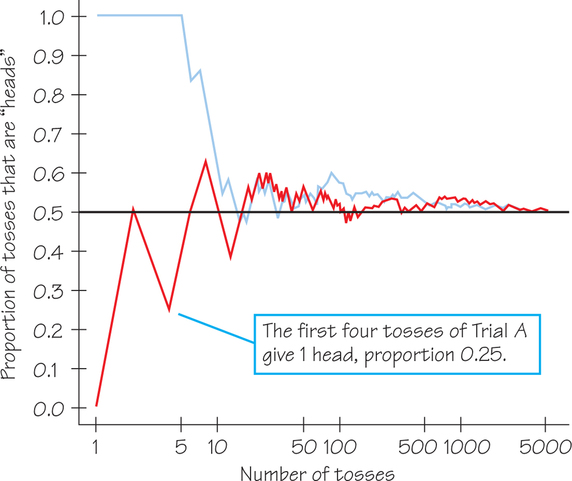
Figure 8.3: Figure 8.3 The proportion of tosses of a coin that gives heads varies as we make more tosses. Eventually, however, the proportion approaches 0.5, the probability of a head. This figure shows the results of two trials of 5000 tosses each. (the horizontal scale is transformed using logarithms to show both short- and long-term behavior.)