19.2 19.1 Fibonacci Numbers and the Golden Ratio
Fibonacci Numbers
Associated with the geometric symmetry in flowers and pinecones is a kind of numeric symmetry, with a “proportion” in the sense of a ratio of numbers. Strangely, the number of spirals in plants is not just any whole number but always comes from a particular sequence of numbers called Fibonacci numbers (see Spotlight 19.1).
Leonardo of Pisa (“Fibonacci”) 19.1
19.1
Born in 1170, Leonardo of Pisa has been known as “Fibonacci” for the past century and a half. This nickname, which refers to his descent from an ancestor named Bonaccio, is modern, and there is no evidence that he went by it.
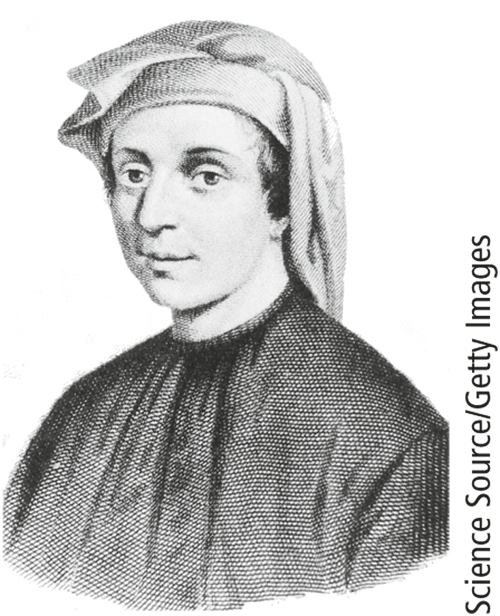 Leonardo of Pisa ("Fibonacci")
A portrait of unlikely authenticity.
Leonardo was the greatest mathematician of the Middle Ages. He introduced calculation with Hindu-Arabic numerals into Italy to replace the Roman numerals and abacus then in use, and he also wrote about geometry, algebra, and number theory. We know little of Leonardo’s life apart from a short autobiographical sketch:
I joined my father after his assignment by his homeland Pisa as an officer in the customhouse located at Bugia [Algeria] for the Pisan merchants who were often there. He had me marvelously instructed in the Arabic-Hindu numerals and calculation. I enjoyed so much the instruction that I later continued to study mathematics while on business trips to Egypt, Syria, Greece, Sicily, and Provence and there enjoyed discussions and disputations with the scholars of those places.
(Translated by L. E. Sigler in Leonardo Pisano, The Book of Squares: An Annotated Translation into Modern English, Academic Press, New York, 1987, p. xvi.)
The Liber abbaci, written in Latin, contains a famous problem about rabbits (see Exercise 4 for details), whose solution is now called the Fibonacci sequence.
The book mentions an earlier version written specifically for merchants. A copy of that book was finally found in 2003, making it the world’s oldest-known arithmetic textbook. In addition to simpler instances of problems from the Liber abbaci, this earlier version includes material on geometry and on the calculation of interest and depreciation. The rabbits problem appears, too, but this time in terms of pigeons instead. (Maybe the outdoor merchants had had enough of pigeons by the time the second version of the book was to appear.)
Fibonacci Numbers (Fibonacci Sequence) DEFINITION
Fibonacci numbers occur in the sequence
1, 1, 2, 3, 5, 8, 13, 21, 34, 55, 89, 144, 233, 377,…
This sequence begins with the numbers 1 and 1 again, and each next number is obtained by adding together the two preceding numbers.

Sequences
Sometimes a sequence of numbers is specified by stating the value of the first term or first several terms and then giving an equation to calculate succeeding terms from preceding ones. This is called a recursive rule, and the sequence is said to be defined by recursion. Let’s denote the nth Fibonacci number by Fn; then the Fibonacci sequence can be defined by the following.
Recursion for the Fibonacci Sequence DEFINITION
F1=1, F2=1 , and Fn+1=Fn+Fn−1. for n≥2
Self Check 1
What is the value of F12?
- 144
The recursive rule just expresses in algebraic form that the next Fibonacci number is the sum of the previous two.
Look at the daisy in Figure 19.1a. There are 21 spirals streaming out in the clockwise direction and 34 harder-to-count ones in the counterclockwise direction—two consecutive Fibonacci numbers.
The common grocery pineapple (Ananas comosus) has three sets of spirals, one each along the three directions through each hexagonally shaped scale: 8 spirals to the right, 13 to the left, and 21 vertically—again, consecutive Fibonacci numbers.
Why are the numbers of spirals in plants the same numbers that appear next to each other in a purely mathematical sequence? There is no easy answer for this phenomenon, which is called phyllotaxis. There are several intricate theories about the dynamics of the plant’s growth that offer explanations (e.g., optimizing total exposure of the leaves to sunlight). Spotlight 19.2 reveals what happens when phyllotaxis is applied to solar energy.
Fibonacci Solar Power 19.2
19.2
A concentrated solar plant (CSP) consists of an array of mirrors (heliostats) that track the sun to reflect and focus sunlight to a central tower, which heats up and converts the heat to steam and then to electricity. Such plants can be enormous, in terms of number of mirrors (hundreds of thousands), area they take up (thousands of acres), and power generated (hundreds of megawatts). The first such plant in the United States, and the largest in the world, is the Ivanpah Solar Power Facility, which has three collecting towers, cost $2.2 billion, and opened in 2014. The plant is in the Mojave Desert near the border between California and Nevada.
A key question in designing such a plant is how to arrange the mirrors efficiently, taking into account the area available, distance of mirrors from the tower (closer is better), and the passage of the sun overhead. But a crucial consideration in design is that at certain times of day a mirror can stand in the shadow of one or more other mirrors, or they can block its reflection to the tower.
Scientists at Mit and at Aachen University in Germany have proposed a new spiral biomimetic pattern for heliostat layout, based on mimicking phyllotaxis—as if the heliostats were leaves on a plant.
The photo below shows the PS20 and PS10 solar plants in Andalsuia, Spain. The accompanying figure shows the design of the PS10 CSP as constructed and also the scientists’ recommended redesign.
In the redesign on the right, you can clearly see the spirals, just as you can see them on sunflowers and pineapples.
The redesign, with the same power output as the existing plant, would use 14% less area. In the case of a plant as large as Ivanpah, the savings in area would be closer to 20%. Alternatively, a plant occupying the same area could produce correspondingly more power.

Drumming Up Mathematics 19.3
19.3
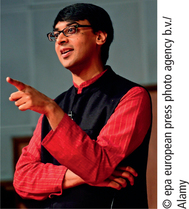
Manjul Bhargava, professor of mathematics at Princeton University, was awarded the fields Medal a few days after his 40th birthday in 2014. There is no nobel Prize in mathematics; the fields Medal is considered on a par in honor (but unfortunately for mathematicians, involves much less prize money). The award was based on his work in number theory, in a field called quadratic forms.
His interest in the subject was prompted in part by rhythms he learned to play on the tabla (a pair of drums), and in part by the mathematical nature of rhythms in Sanskrit poetry. Bhargava has since taught courses on the mathematics involved in music, poetry, and magic.
Meter in Sanskrit poetry depends on sequencing combinations of long and short syllables. The long syllables are regarded as twice as long as the short ones; you may think of a short syllable as occupying a single beat and a long syllable as taking two beats. The question arose, 2000 years ago: for a fixed number n of beats, how many different rhythms of short and long syllables can there be?
Make yourself a table of the rhythms possible for each of n=1 through 5. You should recognize, as the Sanskrit poets did, the pattern in the sequence! Can you explain how, for example, the number of 5-beat rhythms can be traced back to the numbers of 3-beat and 4-beat rhythms?
Other mathematical sequences of integers are inspired not by nature but by rhythms in music and poetry. Spotlight 19.3 tells how those aroused the interest of a mathematician who was recently honored for his achievements.
The Golden Ratio
During the last several centuries, an attractive myth arose suggesting that the ancient Greeks considered a specific numerical proportion essential to beauty and symmetry. This proportion has been known in modern times as the golden ratio, golden mean, or even divine proportion (these are great names, in terms of public relations!). This proportion had been investigated by Euclid in Book II of his Elements, but there is little evidence connecting this proportion to Greek aesthetics. We pursue the golden ratio briefly because of its intimate connection to the Fibonacci sequence and because it does have some appeal as a standard for beautiful proportion.
Golden Ratio DEFINITION
The value of the golden ratio, usually denoted by the Greek letter phi (ϕ), is
ϕ=1+√52≈1.618033
The basic aesthetic claim is that a golden rectangle—one whose height and width are in the ratio of 1 to 1.618—is the most pleasing of all rectangles. In Spotlight 19.4, we show how to construct a golden rectangle that is 1 unit by ϕ units.
How the Greeks Constructed a Golden Rectangle 19.4
19.4
In constructing a golden rectangle, the Greeks started from a 1-by-1 square (outlined in black in the figure), which they made by constructing perpendiculars at the two ends of a horizontal segment of unit length. To extend the square to a golden rectangle, they bisected the original segment, getting a new point that divides it into two pieces of length one-half each. Using this new point and a compass opening equal to the distance from it to a far corner of the square (shown by the diagonal line in the figure), they could add the blue length to the length one-half to get an interval (in red at bottom) with total length ϕ.
A golden rectangle has the “regenerative” property that if you cut a square-shaped piece off one end of it, the rectangle that remains is again a golden rectangle.
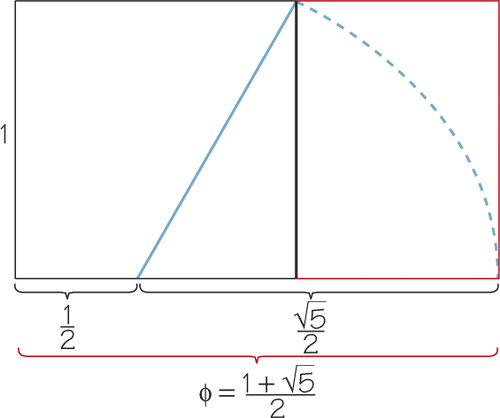
Why would anyone think that this is an attractive ratio? And where did it come from? The answer lies not in Fibonacci numbers but in the Greeks’ pursuit of balance in their study of geometry.
Given two line lengths, one way to find a length that “strikes a balance” between the two is to average them. For lengths l (the larger) and w (the smaller), their average, or arithmetic mean, is m=(l+w)/2, and it satisfies
l−m=m−w
Thinking of the two sides of the equation as pans on a balance, the length m strikes a balance between l and w, in terms of a common difference from the two original lengths. More generally, the arithmetic mean of n numbers or lengths is their sum divided by n. (See Chapter 5 for its use in statistics.)
The Greeks, however, preferred a balance in terms of ratios rather than differences. They sought a length s, the geometric mean, that gives a common ratio
l÷s=s÷w or ls=sw
Multiplying both sides by sw, we obtain lw=s2, which expresses the geometric fact that s is the side of a square whose area equals the area of an l-by-w rectangle (the Greeks thought in terms of geometric objects). In geometry, the geometric mean s is called the mean proportional between l and w (see Figure 19.3).

Geometric Mean DEFINITION
The quantity s=√lw is the geometric mean of l and w.
More generally, the geometric mean of n numbers is the nth root of the product of all n factors multiplied together: The geometric mean of x1, x2…, xn is n√x1⋅x2⋅⋅⋅⋅⋅xn. For example, the geometric mean of 1, 2, 3, and 4 is 4√1⋅2⋅3⋅4=4√24=241/4≈2.213.
Self Check 2
What is the geometric mean of 10, 100, and 1000?
- 100
The Greeks found symmetry and proportion in the geometric mean, but the geometric mean also has important practical applications (see Spotlight 19.5).
The Consumer Price Index: An Application of the Geometric Mean 19.5
19.5
The Bureau of Labor Statistics (BLS) uses the geometric mean—not the arithmetic mean—to calculate the Consumer Price Index (CPI), which tracks changes in the cost of the goods and services that people buy.
The geometric mean takes into account substitutions that consumers make when prices change. For example, if the price of beef goes up but the price of chicken doesn’t, then consumers may buy less beef and substitute the cheaper chicken for some beef.
Suppose that, overall, U.S. families consume equal dollar values of beef and chicken. A typical family might consume weekly 5 lb of beef at $4/lb and 10 lb of chicken at $2/lb, for $20 each and a total cost of $40. We say that beef and chicken each have a relative market share of 0.5 (50% beef, 50% chicken, by dollar value).
What if beef goes up to $6/lb but chicken stays at $2/lb? The relative price change in beef is $6/$4=1.5 and the relative price change in chicken is $2/$2=1.0 (no change). If the average family continues to eat just as much beef and chicken as before, the cost is now $50, an increase of 25%. Because $30 goes for beef and $20 for chicken, the relative market shares have changed to, by dollar value, 60% beef and 40% chicken. The relative price change for the family’s meat is $50/$40=1.25, which is just the arithmetic mean of the two relative price changes (1.50 and 1.00). A more general formulation is
relative price change =old market share of beef×new cost of beefold cost of beef +old market share of chicken×new cost of chickenold cost of chicken =0.5×6.004.00+0.5×2.002.00 =0.75+0.50=1.25
A family that eats no beef sees no increase. A family that eats only beef sees an increase of 50%. The CPI is an average over all families, weighted by the dollar value that each consumes.
If instead we use the geometric mean to calculate a price index, we get a relative price change of √1.50×1.00≈1.225.
The more general formulation is
relative price change=(new cost of beefold cost of beef)(old market share of beef)×(new cost of chickenold cost of chicken)(old market share of chicken)=(6.004.00)0.5×(2.002.00)0.5=√1.50×1.00≈1.225
This relative price change, a 22.5% increase, is less than the 25% using the arithmetic mean.
The intention of the CPI is to measure the change in the cost of goods and services that still yield the same level of satisfaction to consumers. Use of the arithmetic mean presumes that a family buys the same amount of beef and chicken (5 lb beef, 10 lb chicken) as before. Use of the geometric mean presumes that a family buys the same relative dollar value of each meat as before, hence $24.50 (12.25 lb) of chicken and $24.50 (4.08 lb) of beef, for a total of $49=1.225×$40. Buying 2.25 lb more chicken and 0.92 lb less beef is supposed to yield the “same satisfaction” as before.
Because the geometric mean is always less than or equal to the arithmetic mean (see Exercise 19), the geometric mean gives a lower figure for inflation than using the arithmetic mean would produce.
Social Security payments, some wage increases, cost-of-living allowances (COLAs), and income tax rates are all automatically geared to the CPI, which we treat in detail in Chapter 21.
The Obama administration proposed federal budget for 2013–2014 called for changing to a “chained CPI” for calculating the federal payments and adjustments noted above. The chained CPI uses the geometric mean methodology in attempting to account for such substitutions as in our example. The term chained comes from the use of market baskets in adjacent months, thereby “chaining” together succeeding months. As in our example above, the chained CPI gives a lower estimate of inflation, on the order of 0.25% lower per year. Adoption of a chained CPI would result in the government saving money, with the cost borne by senior citizens and the bottom 90% of income-earners.

The Greeks were interested in cutting a single line segment of length l into lengths s and w, with l=w+s, so that s would be the mean proportional between w and l. Surprisingly, the ratio ϕ arises, as we show. Denote by x the common ratio
ls=sw=x
Substituting l=s+w, we get
x=ls=s+ws= ss+ws=1+ws
But w/s is just 1/x, so we have
x=1+1x
Multiplying through by x gives
x2=x+1 or x2−x−1=0
This is a quadratic equation of the form
ax2+bx+c=0
with a=1, b=−1, and c=−1. We apply the famous quadratic formula,
x=−b±√b2−4ac2a
to get the two solutions
x=1+√52≈1.618033 and x=1−√52≈−0.618033
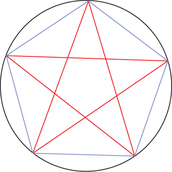
The negative second solution does not correspond to a length. The first solution is the golden ratio ϕ. It occurs also in other contexts in geometry; for example, ϕ is the ratio of a diagonal to a side of a regular pentagon (see Figure 19.4).
The golden ratio has a great myth and mystique attached to it. Some claim that the Great Pyramid was designed with it as a fundamental principle. Others find the golden ratio in proportions of parts of the Greek Parthenon.
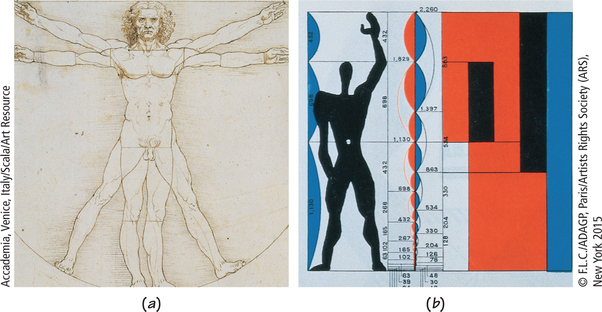
Did Leonardo da Vinci use it in his drawings of the human figure (Figure 19.5a)? In his Mona Lisa, the area from the top of the head of the woman to the top of her bodice appears to form a golden rectangle. It is certainly true that human bodies exhibit ratios close to the golden ratio, as you can see by comparing your overall height to the height of your navel. The Swiss-born architect Charles-Édouard Jeanneret-Gris (1887–1965) definitely used the golden ratio (including a navel-height feature) as the basis for his “Modulor” scale of proportions (Figure 19.5b). (Like many music stars today, he adopted a single name, “Le Corbusier”—a form of his grandfather’s name—in his case as a declaration of reinventing himself.)
More recently, paintings by the Impressionists Gustave Caillebotte (1848–1894) and Georges Seurat (1859–1891) exhibit rectangles in close proportion to the golden ratio. Wolfgang Amadeus Mozart (1756–1791), who was fascinated by mathematics as a student, may have constructed the lengths of parts of some of his piano sonatas with an eye to the golden ratio. Some modern and contemporary artists, such as István (Étienne) Beöthy (1897–1961) and Jo Niemeyer (1946–) have made explicit their inspiration and delight in using the golden ratio in their graphic art and sculpture.
However, in the cases of the Great Pyramid, the Parthenon, Leonardo, the Impressionists, Mozart, and others, we have no evidence of any intention on the part of the artists and architects to use the golden ratio consciously as an artistic organizing principle. The laudatory name golden ratio was not used in antiquity; it dates to the 19th century.
Moreover, experiments show that people’s preferences for dimensions of rectangles are not focused on the golden ratio but cover a wide range, with golden rectangles not holding any special place. A ratio near 1.8 seems the most popular; this ratio is close to the aspect ratio of high-definition TV (see Spotlight 19.6).
Deliberate uses of the golden ratio and Fibonacci numbers include composition of a photograph (a modification of the “rule of thirds"), design of a tartan, and a (dubious) stock-trading strategy.
Are We Trying to Reclaim the “Glory That Was Greece”1? 19.6
19.6
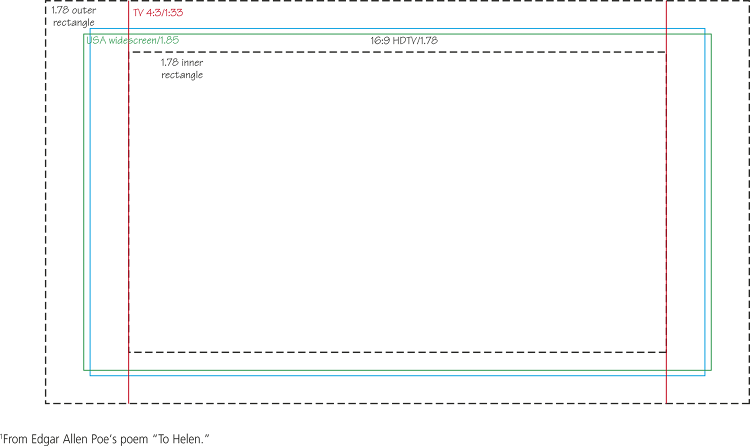
The aspect ratio of an object, such as a computer screen, is the ratio of its width to its height. For a golden rectangle, this is phi, approximately 1.61. An aspect ratio is usually expressed as two numbers separated by a colon; for example, most digital cameras take pictures that have an aspect ratio of 4:3 (pronounced “4 to 3”).
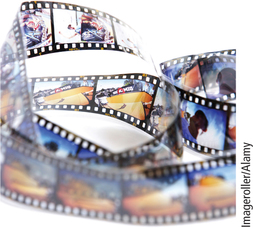
Through the ages, artists have produced canvases of varying sizes and aspect ratios. The introduction of photography on a mass-consumer scale involved standardizing sizes for photographic roll film and for photographic paper prints. A popular size was 36 mm×24 mm (despite the 36, this was called “35 millimeter film,” with an aspect ratio of 3:2=1.5).
Meanwhile, Thomas Edison had introduced movies with an aspect ratio of 4:3, but in 1932 the Academy of Motion Picture Arts and Sciences (which gives out the Academy Awards) settled on a standard film with an aspect ratio of 1.375.
Television came later, with an aspect ratio of 4:3, or 1.33; because that ratio was close to the movies’ 1.375, movies could be shown on TV with very little cropping of the image. Until 1968, TV was in black and white only, while movies in theaters offered color. After TV transitioned to color broadcasting, filmmakers sought a different advantage by providing the “panoramic vision” of widescreen.
1From Edgar Allen Poe's poem “To Helen.”
Movies in the United States evolved to an aspect ratio of 1.85, while those in some European countries evolved to 1.66, with some widescreen films at 2.35.
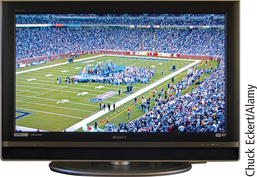
When high-definition TV (HDTV) was developed, a 16:9≈1.78 ratio was chosen as a compromise.
When HDTV is shown on a TV set with a 4:3 aspect ratio but with the original 16:9 aspect ratio preserved, either black bars appear above and below the image (letterboxing) or the image is cropped at the sides. When 4:3 video is presented on HDTV, the original material is often placed in the middle of the screen and black bars appear on sides of the image (pillarbox effect); the alternative is to enlarge the image but crop it at the top and bottom.
The standard HDTV resolutions of “720p” (1280×720 pixels) and “1080p” (1920×1080 pixels) both have exactly a 16:9 aspect.
Computers offer choices for the display resolution, such as 640×480 pixels (4:3) or 2560×1600 pixels (16:10, common on Android tablets). Those aspect ratios are not as high as 1.78, but there is often a “stretched” option that avoids letterboxing or pillar- boxing. However, for the sharpest clarity, the display resolution of the computer video card should match the native resolution of the monitor, so that a pixel of an image file corresponds exactly to a screen pixel.
Smartphones are yet another display arena. The iPhone, for example, has an aspect ratio of 1.5. When you are watching a movie on a smartphone, either the image must be compressed horizontally or the edges of each frame are trimmed.
So over time, there has been an evolution of aspect ratios, from 1.5 for roll film and 1.33 for TV to an eventual 1.78 for HDTV—a compromise value closer to the Greeks’ golden ratio.

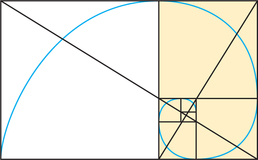
The spirals of the daisy are approximations to a special logarithmic (equiangular) spiral, the golden spiral (Figure 19.6). The mathematical reason for this connection is that the ratios of consecutive Fibonacci numbers
112132538513821131.02.01.51.666…1.61.6251.615…
provide alternately under- and overapproximations that narrow in on ϕ=1.618033….
This fact is easy to show. We assume that there is a limit and show that it must be ϕ. For any n, we have
FnFn−1=Fn−1+Fn−2Fn−1=1+Fn−2Fn−1
Suppose that Fn/Fn−1 tends to a limit x; then Fn−2/Fn−1 tends to 1/x. Substituting, respectively, x and 1/x gives
x=1+1x
which after multiplication by x and rearrangement becomes x2−x−1=0, whose solutions we know to be ϕ and 1−ϕ.
A golden spiral gets wider by a factor of ϕ for each quarter turn. The spiral of the chambered nautilus shell of Figure 19.2b on page 780 is also an equiangular spiral, but the widening factor is approximately 1.3 rather than the golden ratio.
For reasons that we do not understand, some ratios in the DNA molecule are close to the golden ratio; for example, the length of one full cycle of a strand in the double helix is about 1.62 times its width. Perhaps the most surprising appearance of the golden ratio is in connection with black holes, regions of space in which the gravitational field is so strong that nothing can escape (even light). A rotating black hole loses energy and, up to a point, heats up as it does so; after that point—when the mass of the hole equals its angular momentum times the square root of ϕ—the hole starts to cool down instead.