1.2 1.1 Euler Circuits
The street map in Figure 1.1 is typical of many villages and cities across the United States, with streets, residential blocks, and a town park. Our job, or that of the commissioner of parking, is to find the most efficient route for the parking-control officer, who travels on foot, to check the meters in an area. Efficient routes save money. Our map shows only a small area, allowing us to start with an easy problem. But the problem occurs on a larger scale in all cities and towns and for larger areas. The bigger the region involved, the greater the potential for cost savings.
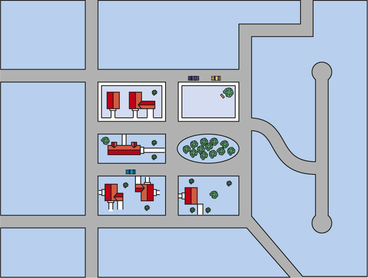
The commissioner has two goals in mind: (1) The parking-control officer must cover all the sidewalks that have parking meters without retracing any more steps than are necessary; and (2) the route should start and end at the same location, perhaps where the officer’s vehicle is parked. To be specific, suppose there are only two blocks that have parking meters, the two lightly shaded blocks that are side by side toward the top of Figure 1.1. Suppose further that the parking-control officer must start and end at the upper left corner of the left-hand block. You might enjoy working out some routes by trial and error and evaluating their good and bad features. We are going to leave this problem for the moment and establish some concepts that will give us a better method than trial and error to deal with this kind of problem.
What Is a Graph? DEFINITION
A graph is a finite set of dots and connecting curved or straight links. The dots are called vertices (a single dot is called a vertex), and the links are called edges. Each edge must connect two different vertices. A graph can represent a city map, a social network, a system of air routes, or electrical power lines.
Path and Circuit DEFINITION
A path is a connected sequence of edges showing a route on the graph that starts at a vertex and ends at a vertex; a path is usually described by naming in turn the vertices visited in traversing it. A path that starts and ends at the same vertex is called a circuit.
EXAMPLE 1![]() Parts of a Graph
Parts of a Graph
We can use the graph in Figure 1.2 to help explain these technical terms. The graph shown has five vertices and eight edges. The vertices represent cities, and the edges represent nonstop airline routes between them. We see that there is a nonstop flight between Berlin and Rome, but no such flight between New York and Berlin. There are several paths that describe how a person might travel with this airline from New York to Rome. The path that seems most direct is New York, London, Rome. But New York, Miami, Rome is also a path with only one “stop.” Furthermore, New York, London, Berlin, Rome is a path. We can describe these three paths as NLR, NMR, NLBR.
Another path would be New York, Miami, London, Berlin, Rome, which can be written NMLBR. An example of a circuit is Miami, Rome, London, Miami. It is a circuit because the path starts and ends at the same vertex. This circuit can best be described in symbols by MRLM. Another example of a circuit in this graph would be LRBL, which is the circuit involving the cities London, Rome, Berlin, and back to London. In this chapter, we are especially interested in circuits, just as we are in real life. Most of us end our day in the same place that we start it—at home!
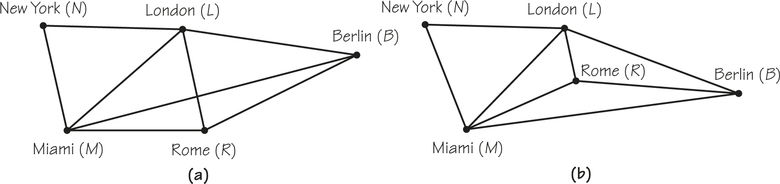
Notice that the edges MB (which could also be denoted BM) and RL shown in Figure 1.2a meet at a point that has no label. Furthermore, this point does not have a dark dot. This is because this point does not represent a vertex of our graph; it does not represent a city. It arises as an “accidental” consequence of the way this diagram has been drawn. We could join M and B with a curved line segment so that the edges LR and MB do not cross, or redraw the diagram so as to avoid a crossing in this case. We will be working often in situations where graphs can be drawn without accidental crossings, and we will try to avoid such crossings when it is convenient to do so. However, there are infinitely many graphs for which—when they are drawn on a flat piece of paper—accidental crossings are unavoidable. (Figure 2.12 on page 52 is an example of such a graph.)
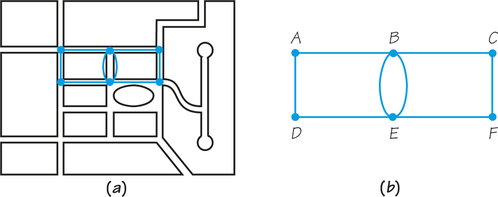
Returning to the case of parking enforcement in Figure 1.1, we can use a graph to represent the whole territory to be patrolled: Think of each street intersection as a vertex and each sidewalk that contains meters as an edge, as in Figure 1.3. Notice in Figure 1.3b that the width of the street separating the blocks is not explicitly represented; it has been shrunk to nothing. In effect, we are simplifying our problem by ignoring any distance traveled in crossing streets. In drawing graph diagrams such as those in Figure 1.3 or Figure 1.5, we usually use straight line segments to represent edges. However, sometimes we cannot avoid the use of “curves,” or we may prefer to use curved edges because they convey aspects of the original problem that we desire to emphasize.
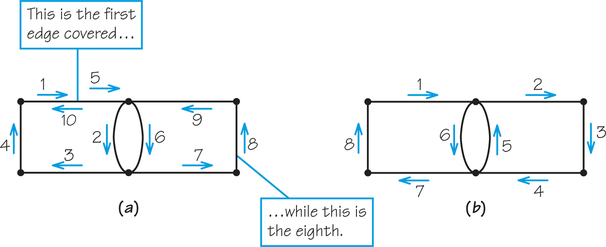
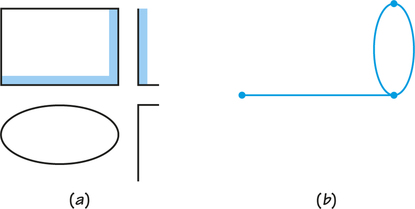
The sequence of numbered edges in Figure 1.4a shows one circuit that covers all the meters. (Note that it is a circuit because its path returns to its starting point.) However, one edge is traversed three times. Figure 1.4b shows another solution that is better because its circuit covers every edge (sidewalk) exactly once. In Figure 1.4b, no edge is covered more than once, or deadheaded (a term borrowed from shipping, which means making a return trip without a load). When deadheading is required in an applied situation, such as inspecting parking meters or pothole inspection, typically time and effort is being spent but no productive work is accomplished because the productive work was done the first time the edge was covered (traversed).
Euler Circuit DEFINITION
A circuit that covers each edge of a graph once, but not more than once, is called an Euler circuit.
Figure 1.4b shows an Euler circuit. These circuits get their name from the great Swiss-born mathematician Leonhard Euler (pronounced oy’ lur), who first studied them (see Spotlight 1.1). Euler was the founder of the theory of graphs, or graph theory. One of his first discoveries was that some graphs have no Euler circuits at all.
Leonhard Euler 1.1
1.1
 Leonhard Euler
Leonhard Euler (1707–1783) was remarkable in many ways. He was extremely prolific, publishing over 500 works in his lifetime. But he wasn’t devoted just to mathematics; he was a people person, too. He was extremely fond of children and had 13 of his own, of whom only five survived childhood. It is said that he often wrote difficult mathematical works with a child or two in his lap.
Human interest stories about Euler have been handed down through three centuries. He was a prodigy at doing complex mathematical calculations under less than ideal conditions, and he continued to do them even after he became totally blind later in life. His blindness diminished neither the quantity nor the quality of his output. Throughout his life, he was able to mentally calculate in a short time what would have taken ordinary mathematicians hours of pencil-and-paper work. A contemporary claimed that Euler could calculate effortlessly, “just as men breathe, as eagles sustain themselves in the air.” His collected works and numerous letters to other scholars of his day are still being published.
Euler invented the idea of a graph in 1736 when he solved a problem in “recreational mathematics.” He showed that it was impossible to stroll a route visiting the seven bridges of the German town of Königsberg exactly once. Ironically, in 1752 he discovered that three-dimensional polyhedra obey the remarkable formula V-E+F=2 (that is, number of vertices − number of edges + number of faces = 2) but failed to give a proof because he did not analyze the situation using graph theory methods. Sometimes even a genius can miss something.
For example, in the graph in Figure 1.5b, it would be impossible to start at one point, return to that starting vertex and cover all the edges without retracing some steps: If we try to start a circuit at the leftmost vertex, we discover that once we have left the vertex, we have “used up” the only edge meeting it. We have no way to return to our starting point except to reuse that edge. But this is not allowed in an Euler circuit. If we try to start a circuit at one of the other two vertices, we likewise can’t complete it to form an Euler circuit.
As mentioned in Spotlight 1.2, realistic problems of this type involve larger neighborhoods that might require the use of a computer. In addition, there may be other complications that might take us beyond the simple mathematics we want to stick to.
The Human Aspect of Problem Solving 1.2
 Thomas Magnanti
Thomas Magnanti, professor of operations research and management science, is former Dean of Engineering at MIT. Here are some of his observations:
Typically, a management science approach has several different ingredients. One is just structuring the problem—understanding that the problem is an Euler circuit problem or a related management science problem. After that, one has to develop the solution methods.
But one should also recognize that you don’t just push a button and get the answer. In using these underlying mathematical tools, we never want to lose sight of our common sense, understanding, intuition, and judgment. The computer provides certain kinds of insights. It deals with some of the combinatorial complexities of these problems very nicely. But a model such as an Euler circuit can never capture the full essence of a decision-making problem.
Typically, when we solve the mathematical problem, we see that it doesn’t quite correspond to the real problem we want to solve. So we make modifications in the underlying model. It is an interactive approach, using the best of what computers and mathematics have to offer and the best of what we, as human beings, with our own decision-making capabilities, have to offer.
Because we are interested in finding circuits, and Euler circuits are the most efficient ones, we want to know how to find them. If a graph has no Euler circuit, we want to develop efficient, alternative tours, those having minimum deadheading. These topics make up the rest of this chapter.